
The DNA Polymerase δ Has a Role in the Deposition of Transcriptionally Active Epigenetic Marks, Development and Flowering
Three DNA polymerases replicate DNA in Eukaryotes. DNA polymerase α (Polα) initiates strand synthesis, which is performed by Polε and Polδ in leading and lagging strands, respectively. Not only the information encoded in the DNA, but also the inheritance of chromatin states is essential during development. Loss of function mutants in DNA polymerases lead to lethal phenotypes. Hence, hypomorphic alleles are necessary to study their roles beyond DNA replication. Here we identify a thermosensitive mutant of the Polδ in the model plant Arabidopsis thaliana, which bears an aminoacid substitution in the polymerase-domain. The mutants were essentially normal at 18°C but arrested development at 28°C. Interestingly, at 24°C we were able to study the roles of Polδ in epigenetic inheritance and plant development. We observed a tight connection between DNA replication stress and an increase the deposition of transcriptionally active chromatin marks in the SEPALLATA3 (SEP3) locus. Finally, we tested by genetic means that the ectopic expression of SEP3 was indeed the cause of early flowering and the leaf phenotypes by promoting the expression of FLOWERING LOCUS T (FT). These results link Polδ activity to the proper establishment of transcriptionally active epigenetic marks, which then impact the development of multicellular organisms.
Published in the journal:
The DNA Polymerase δ Has a Role in the Deposition of Transcriptionally Active Epigenetic Marks, Development and Flowering. PLoS Genet 11(2): e32767. doi:10.1371/journal.pgen.1004975
Category:
Research Article
doi:
https://doi.org/10.1371/journal.pgen.1004975
Summary
Three DNA polymerases replicate DNA in Eukaryotes. DNA polymerase α (Polα) initiates strand synthesis, which is performed by Polε and Polδ in leading and lagging strands, respectively. Not only the information encoded in the DNA, but also the inheritance of chromatin states is essential during development. Loss of function mutants in DNA polymerases lead to lethal phenotypes. Hence, hypomorphic alleles are necessary to study their roles beyond DNA replication. Here we identify a thermosensitive mutant of the Polδ in the model plant Arabidopsis thaliana, which bears an aminoacid substitution in the polymerase-domain. The mutants were essentially normal at 18°C but arrested development at 28°C. Interestingly, at 24°C we were able to study the roles of Polδ in epigenetic inheritance and plant development. We observed a tight connection between DNA replication stress and an increase the deposition of transcriptionally active chromatin marks in the SEPALLATA3 (SEP3) locus. Finally, we tested by genetic means that the ectopic expression of SEP3 was indeed the cause of early flowering and the leaf phenotypes by promoting the expression of FLOWERING LOCUS T (FT). These results link Polδ activity to the proper establishment of transcriptionally active epigenetic marks, which then impact the development of multicellular organisms.
Introduction
Arabidopsis is a facultative long-day (LD) plant, meaning that LDs accelerate flowering whereas in short days (SD) flowering is delayed. Flowering in spring (LDs) is therefore promoted by GIGANTEA (GI), CONSTANS (CO) and FLOWERING LOCUS T (FT) which constitute the so called “photoperiod pathway”. GI activates CO which eventually accumulates in the late afternoon and early night under LD conditions and induces the expression of FT in phloem companion cells. The protein FT is an universal florigen and moves to the apical meristem to promote the transition to flowering [1–3].
In plants, epigenetic inheritance confers a cellular memory of past environmental conditions. The winter ecotypes of Arabidopsis thaliana require a prolonged exposure to near freezing temperatures, or vernalization, to become competent to flowering in spring [4]. Plants are able to “remember” the past winter because persistent cold exposure (2–4 weeks) activates an epigenetic mechanism that requires the trimethylation of Lysine 27 of histone 3 (H3K27me3), which permanently represses FLOWERING LOCUS C (FLC) [4].
The pathways that respond to photoperiod and vernalization are integrated at the level of FT, which is directly repressed by FLC [4,5]. The FT gene is also known as a “flowering integrator” because it also responds to other flowering pathways including the thermosensory and autonomous pathways [4,5]. The complex regulation of FT expression is due at least in part to epigenetic mechanisms [6–10]. The chromatin of FT is enriched in H3K27me3; curly leaf (clf) and terminal flowering 2/like heterochromatin protein 1 (tfl2/lhp1) mutants, which are defective in the H3K27 methylase and H3K27me3 binding activity, are early flowering and photoperiod insensitive due to high expression of FT [9,11–13].
The terminal differentiation of specialized tissues in multicellular organisms is strongly influenced by the previous DNA replication events of the cells that constitute each tissue. In Eukaryotes, three replicative DNA polymerases (Polα, Polε and Polδ) are responsible for the faithful duplication of the nuclear genome [14]. Polα forms a complex with a primase to initiate replication at origins and Okazaki fragments and these short stretches of RNA-DNA hybrids are extended by Polε in the leading strand and Polδ in the lagging strand [14].
Apart from their essential role in DNA replication, Polα and Polε are required for other non-essential functions such as the maintenance of transcriptional silencing in yeast. In this alternative role, Polε is part of a mechanism that processes transcripts into siRNAs to reinstall transcriptional silencing [15]. In plants, mutants versions of Polα and Polε led to changes in histone marks, resulting in elevated FT expression together with increased flower homeotic gene expression, which produced early flowering and curly leaf phenotypes [11,16–19]. However, which genes are the primary targets of the defective-polymerase induced epigenetic changes remains unclear.
Unlike Polα and Polε, the role of the Polδ in epigenetic inheritance has not been addressed so far. Besides lagging strand synthesis, Polδ also participates in many other processes that repair DNA lesions required to protect genome integrity [20,21].
Reports in yeast and plants have shown that a reduction in the amount of Polδ leads to genome instability and hyperrecombination phenotypes [20–22]. In mammals, mutations in the proofreading domain of Polδ produce predisposition to cancer. For instance, a POLD1 S478N variant in human populations predisposes to colorectal tumors and endometrial cancer [23].
Although the fact that replicative polymerases are essential in most studied organisms, viable mutant alleles of pola1 (At5g67100, encoding the catalytic subunit of Polα and pole1 (At1g08260, encoding the catalytic subunit of Polε were isolated in multiple genetic screenings [11,16,18,19,24,25]. However, viable hypomorphic alleles of POLD1 were not isolated so far, which may be due to its essential roles in DNA replication and repair. Here, we report the isolation of gigantea suppressor 5 (gis5), the first plant POLD1 viable mutant allele, which also proved to be thermosensitive. Under restrictive temperatures, the gis5 allele led to early flowering and curly leaf phenotypes which were dependent on the FT gene but caused by overexpression of SEP3, which showed a correlation with increased trimethylation of Lysine 4 (H3K4me3) at the SEP3 locus. These phenotypes mostly disappeared at permissive temperatures. Our findings reveal an unforeseen function of Polδ that may be linked to the correct establishment of transcriptionally active epigenetic marks during DNA replication.
Results
Isolation of gigantea suppressor 5
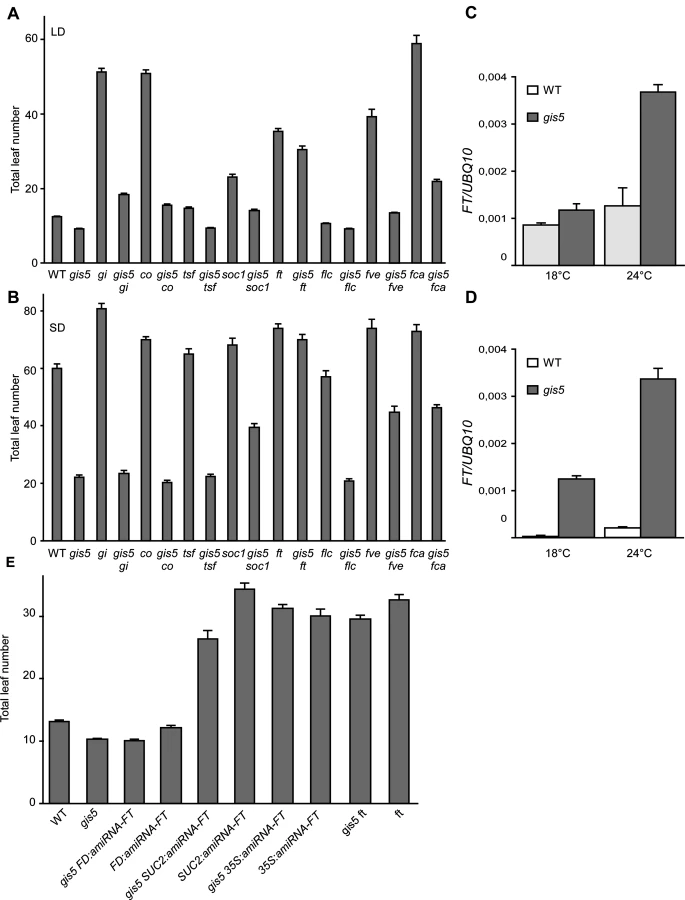
We performed a genetic screen for induced mutations that suppressed the late flowering phenotype of gi-2 mutants, with the aim to isolate genes involved in the interaction between photoperiod and thermosensory pathways. One of the ethyl methanesulfonate (EMS)-induced mutations suppressed most of the gi-2 late flowering phenotype under long days (LD) conditions and was named gigantea suppressor 5 (gis5) (Fig. 1A). The gis5 mutation also accelerated flowering in a wild type (WT) background (Fig. 1A) so we used gis5 in this background in subsequent experiments. We also observed that in the WT background—but not in the gi-2 background–, gis5 displayed a curly leaf phenotype, reminiscent of curly leaf (clf) mutants [12]. Interestingly, the curly leaf phenotype depended on temperature, i.e.: it was strong at 24°C but disappeared at 18°C (Fig. 1B-C). We decided to evaluate whether the flowering phenotype of gis5 mutants was also temperature-dependent. Under LD, the flowering phenotype of gis5 mutants was relatively insensitive to temperature in the range 18–24°C (Fig. 1D). In stark contrast, the gis5 early flowering phenotype was mostly suppressed when plants were grown at 18°C under short days (SD) (Fig. 1E).

gis5 Encodes the Catalytic Subunit of the DNA Polymerase δ
We mapped gis5 to a 120kb interval delimited by markers CER436434 and CER436454 (http://www.arabidopsis.org/browse/Cereon/index.jsp [26]) (Fig. 2A). We detected a C to T transition in the 18th exon of the gene encoding the catalytic subunit of Polδ (POLD1, AT5g63960) which led to a A707V substitution (Fig. 2A). To confirm that the gis5 mutation was the cause of the observed phenotypes, we complemented gis5 mutants with a WT genomic fragment containing the complete POLD1 gene with its own promoter and terminator sequences. Four independent transgenic lines, with single locus T-DNA insertions were evaluated and in all cases, the curly leaf phenotypes and the early flowering under both LD and SD were complemented to a high degree (Fig. 2B; S1A Fig.).

The A707V Mutation May Affect Polδ Activity
The A707 residue is perfectly conserved in δ DNA polymerases from other eukaryotes (S1B Fig.). We modeled WT and mutant POLD1 using the yeast crystal structure of Pol3 as a template (PDB: 3IAY) [27]. Both proteins share 50% identity, which suggests that this particular model could be as accurate as one obtained from low resolution X-ray crystallography [28]. The A707V mutation is located in a α-helix from the finger domain (Fig. 2C) which interacts with the nucleotide substrate during DNA polymerization. Interestingly, the A707 does not interact directly with the substrate and the A to V substitution does not affect the protein structure in any obvious manner (Fig. 2C, lower panel). Further, the A707 residue is inaccessible to the solvent, suggesting that it is not directly involved in protein to protein interactions (Fig. 2C; S1C Fig.). As the yeast Polδ conformation changes upon substrate binding [29], we modeled POLD1 in both substrate-free (4FVM) and bound (4FYD) conformations using X-Ray models from POLA1 (29% identity) as references (S1C Fig.). The α-helix bearing the A707 is greatly displaced when comparing both models, suggesting that the α-helix moves during catalysis (S1C Fig.) and that the A707V substitution may affect POLD1 activity. This was further supported by the fact that Val is known to destabilize α-helices, when replacing Ala residues [30]. Hence, the gis5 mutation might increase the finger instability at higher temperatures.
The gis5 Alelle Is Thermosensitive
We reasoned that if the observed temperature-dependent phenotypes were due to a defect in the activity of Polδ, then we should observe similar temperature dependence on other phenotypes not related to flowering. It has been previously shown that suppression of Polδ by RNAi triggers a DNA replication stress response, including an increase in Homologous Recombination (HR) [31]. Hence, we tested if gis5 mutants displayed a DNA replication stress response and whether this response was temperature-dependent. Interestingly, the mRNA levels of BRCA1 and RAD51, two genes involved in HR, increased at 24°C in the gis5 mutant, but only relatively weak effects were observed at 18°C (Fig. 3A). To evaluate if these changes promoted HR, we used HR reporter lines that bear halved fragments of GUS reporter genes which are reconstituted after HR events [31]. We quantified HR events, seen as blue dots after X-Gluc staining, and observed that HR events were relatively few at 18°C and greatly increased in gis5 mutants (more than 100-fold) by growing plants at 24°C (Fig. 3B; S2 Fig.).

To further test if problems in DNA replication appeared at higher temperatures we introduced a pCYCB1–1:GUS reporter line in gis5 mutants. This reporter is used to reveal cells in late G2 phases [32]. The number of GUS stained cells increased in gis5 roots, but only at 24°C, thus suggesting that, at higher temperatures, defects in DNA replication accumulated in gis5 cells and demanded more time for HR-dependent repair during the G2/M transition (Fig. 3C).
We reasoned that if the gis5 allele were thermosensitive, further increasing temperature above 24°C would impair development. gis5 mutants grown at 28°C were severely affected, resembled dwarfed plants that did not set seeds and eventually died even in axenic culture (Fig. 3D).
FT Acts Downstream of the gis5 Mutation
To evaluate which flowering pathways are affected by the gis5 mutation, we investigated the epistatic relationships between gis5 and those mutations affecting the photoperiod, autonomous and vernalization pathways (Fig. 4A-B).
Mutations in the photoperiod pathway co-9 and gi-2 did not suppress gis5 early flowering phenotype under both LD and SD conditions, suggesting that gis5 is acting either downstream of these genes in the photoperiod pathway or in a parallel pathway (Fig. 4A-B).
The effects of autonomous and thermosensory pathways mutations [33], fve-3 and fca-9, were mostly additive to gis5 and the double mutants showed intermediate flowering phenotypes, suggesting that gis5 affects parallel pathways to those affected by fve-3 and fca-9 (Fig. 4A-B).
FLC acts downstream of the vernalization and autonomous pathways. The gis5 mutation produced a decrease in FLC mRNA levels in WT and fca-9 backgrounds which could indicate that gis5 might control flowering through the levels of FLC transcripts (S3A Fig.). Notwithstanding, gis5 mutants flowered much earlier than flc mutants, especially in SD (Fig. 4A-B), and the flc mutation did not further accelerate flowering in the gis5 background, suggesting that gis5 was acting mostly downstream of FLC. Hence, a role for FLC in gis5 early flowering seemed minor in the Col background used here, but may be more important in vernalization requiring accessions. Interestingly, the ft mutation suppressed most of the gis5 early flowering phenotype under both LD and SD (Fig. 4A-B), suggesting that FT acts downstream gis5. A mutation in the other flowering integrator gene, suppressor of overexpression of constans 1 (soc1), resulted in an intermediate effect when evaluated in the gis5 background, which is consistent with SOC1 being one of the downstream targets of FT [34]. A mutation in a third integrator gene, twin sister of ft (tsf), showed marginal effects in our conditions in gis5 and WT genetic backgrounds. Together, these results suggested that FT could be downstream of gis5 and prompted us to measure FT mRNA levels. FT was highly expressed in the gis5 background in both continuous light and SD (Fig. 4C-D). Further, the expression of FT was highly dependent on temperature in the gis5 mutant background.
To test if ectopic or tissue specific overexpression of FT was related to the gis5 phenotype, we evaluated the pattern of expression of the β-glucuronidase (GUS) reporter gene under the FT promoter [6]. GUS expression in gis5 P8.1kbFT:GUS plants was limited to the vascular tissue and was not detected in the apical meristem (S3B Fig.). These results, together with qRT-PCR data (Fig. 4C-D), show that FT is overexpressed in vascular tissue in gis5 mutants. To test if this overexpression is functional, we used artificial microRNAs directed against FT mRNA, as previously reported [3]. When artificial microRNAs were expressed under the companion-cell specific promoter SUC2, the early flowering of gis5 was greatly suppressed, while expression under the apical meristem specific FD promoter had no effect in the gis5 mutant background (Fig. 4E). These results taken together showed that FT overexpression within vascular tissue was necessary for the gis5 early flowering phenotype and were also consistent with the curly leaf phenotype observed in strong FT overexpressors [35].
Despite the fact that high expression of FT could explain both the temperature dependence and the leaf and early flowering phenotypes of gis5 mutants, the underlying mechanism was unclear.
High Expression Levels of SEP3 Are Temperature Dependent and Mostly FT-Independent in the gis5 Mutant
The data presented above show that FT acts downstream gis5 and is also necessary for the expression of gis5 early flowering and curly leaf phenotypes. However, how a mutation in Polδ produced such effects was still unclear. To obtain an insight on the mechanisms, we performed a microarray analysis to study the transcriptome of gis5 mutants to investigate if other factors could be acting upstream FT and be direct targets of the gis5 allele. The genes were ordered based on the effect of gis5 on their expression. Only a few flowering genes were found among the upregulated and downregulated genes. SEP3 was at the top of the list, which also included SEP1 and SEP2 (S1 Table). Intriguingly, it has been reported that SEP3 overexpression accelerates flowering and leaf curling [36–38]. Further, a recent report has shown that SEP3 can act also upstream of FT and that both genes mutually regulate each other in a positive manner [38]. Hence, we decided to evaluate the expression of SEP genes under different photoperiod and temperature conditions in gis5 mutants. SEP1, SEP2 and SEP3 mRNAs were expressed at very high levels in the gis5 mutants under continuous light, and this effect was highly dependent on temperature (Fig. 5), which correlates well with the phenotype of gis5 mutants.

As FT was reported to act upstream of SEP3 in a thermosensory pathway [39], the temperature-dependence of gis5 phenotypes could be due to the amplification of an underlying response to temperature. We reasoned that under SD conditions and low temperatures (18°C), SEP3 expression should be independent of both the photoperiod and the thermosensory pathways; in contrast, under elevated temperatures (24°C) the thermosensory pathway would increase SEP3 expression in an FT-dependent manner. Hence, we also tested the expression of SEP genes in plants grown in SD in the ft mutant background. The three SEP genes were affected by the ft mutation in the gis5 background only at 24°C and their expression dropped by about 50% in the double gis5 ft mutants (Fig. 5B), which is consistent with SEP3 acting downstream FT in the thermosensory pathway [39]. However, the expression of SEP genes was highly elevated (30 to 100 fold) in the double gis5 ft mutants with respect to ft single mutants, revealing an FT-independent effect on SEP gene expression in gis5 plants. Interestingly, despite the high expression levels of SEP3 in gis5 plants, FT was still required for early flowering (Fig. 4). Among the SEP genes, SEP3 showed the strongest temperature response in the gis5 ft double mutants (4.4 fold), SEP1 showed a partial response (1.7 fold) and SEP2 showed no response to temperature. Taken together, these results suggested that at higher temperatures the gis5 mutation might cause increased FT expression and curly leaf as well as early-flowering phenotypes by elevating SEP3 expression.
Active Chromatin Marks in the SEP3 Locus Increase in gis5 Mutants in a Temperature-dependent Manner
Since the SEP3 locus was shown to be actively repressed by H3K27me3 marks [40], we evaluated if the V707A mutation in Polδ could affect histone marks in the SEP3 locus in a manner that is dependent on the temperature. We performed chromatin immunoprecipitation (ChIP) experiments to quantify H3K27me3, H3Ac and H3K4me3 enrichment at the SEP3 locus in WT and gis5 mutants grown at either 18 or 24°C. We did not find changes in H3K27me3 marks enrichment but a significant enrichment (about 5-fold) in H3K4me3 marks, which peaked in the first intron of SEP3 and decreased towards the 3´end (Fig. 6, top right panel, S4 Fig. and S7 Fig.). Importantly, this enrichment in H3K4me3 marks on the SEP3 locus was also dependent on temperature, showing a correlation with expression data (Fig. 5, lower left panel, Fig. 6, top panels, and S4 Fig.). H3Ac also increased in a temperature-dependent way and more likely reflects the increased transcriptional activity at the SEP3 locus [41].
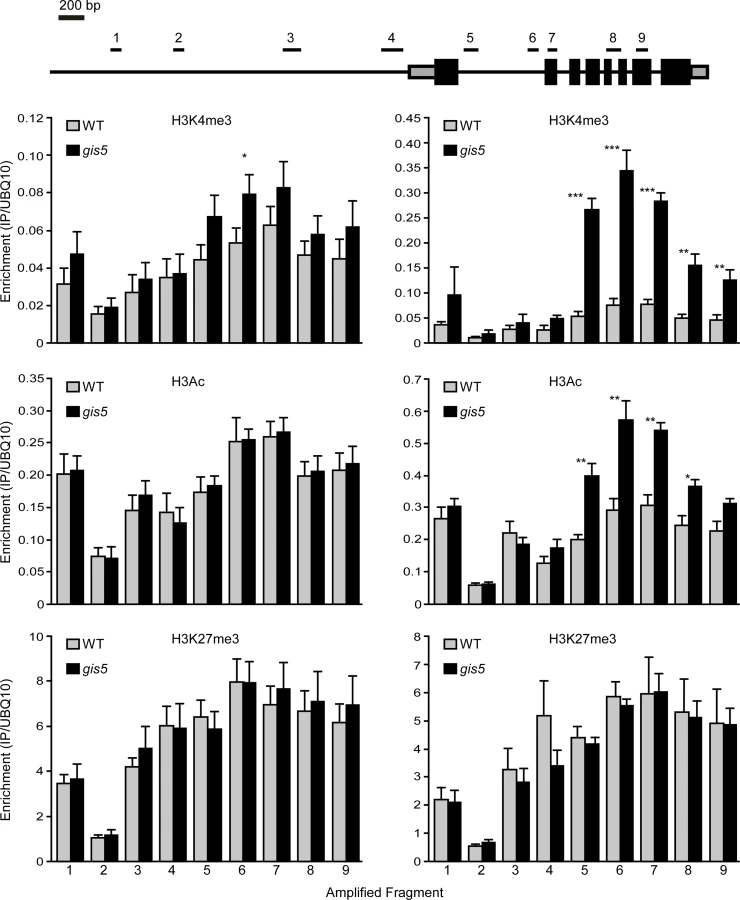
Since mutations in Polα and Polε were proposed to affect histone mark deposition at FT and FLC loci [11,16,17,19], we decided to study the deposition of histone modifications at both loci, in the WT and gis5 mutants at both 18 and 24°C. Despite higher FT mRNA and lower FLC mRNA levels in gis5 mutants, ChIP against H3Ac, H3K4me3 and H3K27me3, followed by qPCR of locus-specific fragments, did not reveal temperature-dependent changes at both the FT and FLC loci, except for a marginal increase in H3K4m3 at the FT locus which was not statistically significant (S5 Fig., S6 Fig. and S7 Fig). These results supported the notion that the SEP3 locus was a primary target of a gis5-produced epigenetic modification.
The gis5 Phenotype Depends on a SEP3-FT Feedback Loop in Phloem Tissue
To test if the elevated SEP3 expression could be the cause of the early flowering and curly leaf phenotypes of gis5 mutants, we suppressed SEP3 expression in the gis5 background using artificial microRNAs. Transgenic gis5 lines bearing artificial microRNAs against SEP3 showed low SEP3 expression, decreased FT expression, later flowering and plain leaves (Fig. 7; S5A Fig.). On the contrary, microRNAs against SEP1 did not show a significant effect on their own and subtle effects (if any) when coexpressed together with a microRNA against SEP3 (Fig. 7A). Further, expression of a microRNA against SEP3 under the phloem specific promoter SUC2 led to a suppression of both early flowering and curly leaf phenotypes (Fig. 7) while the same microRNA under the FD promoter did not show any effect (Fig. 7C).

These pieces of evidence strongly support the notion that increased H3K4me3 marks on the SEP3 locus and concomitant overexpression in phloem tissue are the main cause of the early flowering and leaf phenotypes of the gis5 mutants. Conversely, the DNA replication stress response in gis5 mutants was independent of SEP3 expression levels, since the expression of HR marker genes BRCA1 and RAD51 in gis5 background was not suppressed by suppressing SEP3 expression (S8B Fig.). These results strongly suggest that the DNA replication stress response is activated upstream SEP3 in gis5 mutants and it is not a byproduct of accelerated development.
The FLC expression levels were lower in gis5 mutants and interestingly, these effects were also independent of SEP3 (S8A Fig.) suggesting that FLC might have a minor SEP3-independent role in gis5 early flowering.
The results shown above are consistent with a model where a decrease in Polδ activity in gis5 mutants at higher temperatures leads to an increase in the expression of SEP3, resulting in a feedback loop with FT in vascular tissue to induce flowering and curly leaves phenotypes (Fig. 7D).
Despite SEP3 overexpression can account for the gis5 phenotypes tested here, it remains unclear whether the gis5 mutation leads to H3K4me3 increases in other loci. Our microarray results showed that the expression of only 81 genes changed by at least two-fold in the gis5 mutant with respect to the WT, suggesting that the effects of the gis5 allele are restricted at most, to a relatively small number of loci. To test if other loci displayed changes in H3K4me3 levels, we performed ChIP experiments with a subset of genes selected from the microarray, SEP1, PCC1, and ASN. Both SEP1 and PCC1 were highy expressed (S1 Table) and also displayed a temperature-dependent increase in H3K4me3 levels (S9 Fig.), whereas ASN was downregulated and did not display increased H3K4me3 levels (S9 Fig.). These results show that the gis5 allele might affect other loci diffetent from SEP3 which may account for other phenotypes not evaluated here.
Discussion
Here we describe the isolation of a novel flowering mutant, gis5, which flowers early and displays curly leaves. These phenotypes are due to an A707V substitution in the catalytic subunit of the Arabidopsis Polδ encoded by the POLD1 gene. Null POLD1 alleles are embryo lethal (http://www.seedgenes.org/ [31]). To our knowledge, gis5 is the first hypomorphic and viable allele to be isolated and, interestingly, it is thermosensitive. This is supported by the weak phenotypes of gis5 mutants grown at 18°C, the strong early flowering and curly leaf phenotypes of plants grown at 24°C and the lethality of plants grown at 28°C. Further, the gis5 mutation also produced a DNA replication stress response and an increase in HR which were also temperature-dependent. It is likely that at 18°C both Polε and Polδ advance in the replication fork in a coordinated manner. At 24°C the lower activity of the gis5 allele would lead to larger single strand DNA stretches and eventually to DSB and increased HR, which is the mechanism to repair DSB [20]. Genetic instability was previously reported in Arabidopsis lines with low POLD1 expression levels [31]. However, defects in epigenetic inheritance were not observed in those RNAi lines and transcriptomic analysis in those lines did not reveal changes of importance. These results, together with our data suggest that the gis5 effects on epigenetic inheritance might result from a specific change in Polδ behavior rather than just decreased levels.
In a previous report, the incorporation of H2AZ to nucleosomes was proposed to be a mechanism of temperature perception, and its failure led to early flowering [42]. It is unlikely that a similar effect in temperature responsiveness is occurring in gis5 mutants because the genes misexpressed in gis5 mutants do not overlap with those misexpressed in mutants that fail to incorporate H2AZ [42]. Only one out of ten of the temperature responsive markers followed up by Kumar & Wigge (2010) showed a significant change in our microarray data of gis5 mutants.
The early flowering and curly leaves phenotypes of gis5 mutants are caused by high expression levels of SEP3 which activates FT in phloem tissue. This is supported by our expression and genetic data and also consistent with previous reports showing that SEP3 overexpression accelerates flowering and produces curly leaves [36–38]. SEP3 is well known to play roles in flower development downstream of FT [36,37], which is also consistent with SEP3 mRNA levels decreasing by about 50% in the ft gis5 double mutants with respect to gis5 single mutants. However, SEP3 mRNA levels were still very high (about 30-fold) in ft gis5 double mutants compared to either ft single mutants or WT plants indicating that gis5 increases SEP3 expression independently of FT. These results led us to propose that SEP3 and FT form a positive feedback loop in gis5 mutants, similar to the mutual activation of SEP3 and FT reported in clf mutants [38], although we do not have evidence to assume that this mutual regulation is direct. The SEP3-FT feedback loop also explains why gis5 early flowering is more dependent on temperature under SD compared to LD and continuous light. Under LD, FT mRNA levels increase in response to the photoperiod pathway contributing to the feedback loop and compensating for the decrease in SEP3 gene activation at lower temperatures.
The strong changes in SEP3 expression and the increases in H3K4me3 at the SEP3 locus were both temperature-dependent and correlated well with the DNA replication stress responses and the increase in HR, suggesting that changes in SEP3 epigenetic marks and expression were produced by the changes in the dynamics of DNA replication. Despite the fact that we cannot exclude the possibility that the effects on the SEP3 locus were indirect (i.e. by activating a SEP3 activator), we find this explanation rather unlikely because i) SEP3 was the top upregulated gene in gis5 mutants by our microarray data, ii) known SEP3 regulators or SEP3 corregulated genes such as FUL and SPL3 were not upregulated in our microarrays and iii) two direct transcriptional repressors of SEP3, SVP and AGL24 [43], were not downregulated in our microarrays. Hence, these pieces of evidence strengthen the idea that the effects of gis5 are direct on the SEP3 locus.
gis5 could affect SEP3 expression by changing its pattern of histone post-translational modifications. Increased H3Ac more likely reflects the increased transcriptional activity at the SEP3 locus [41,44]. H3K4me3 also correlates with increased transcriptional activity but it was also shown to function as a memory of recent transcriptional activity [41,44,45]. Two scenarios are then possible, that the gis5 mutation produces an increase in SEP3 expression and as a consequence, an increase in H3K4me3, or that an increase in H3K4me3 causes an increase in SEP3 transcription. We favor this second hypothesis. An increase H3K4me3 deposition at the SEP3 locus could result from of an interaction between Polδ and the local chromatin during the maturation of Okazaki fragments. In yeast, the ligation of Okazaki fragments take place at nucleosome midpoints, implying that nucleosomes are loaded immediately after the passage of the replication fork [46]. Further, some transcription factor binding sites are also preferentially sites of Okazaki fragment ligation. These DNA bound proteins restrain excessive strand displacement by Polδ during Okazaki fragment maturation, causing Polδ to dissociate from DNA. When Polδ processivity was perturbed, the site of Okazaki fragment ligation changed consistently with Polδ dissociating before the nucleosome mid-point [46]. These data raise the possibility that the gis5 allele of Polδ may be more sensitive to the local chromatin structure at the SEP3 locus dissociating earlier during local Okazaki fragment maturation. If strand-displacement synthesis by Polδ is required to remove H3K4me3 incorporated during the previous Okazaki fragment synthesis, Polδ premature dissociation would eventually lead to overaccumulation of H3K4me3, which could then be involved in a positive feedback loop with transcription.
Whether the mechanisms underlying the early flowering and curly leaf phenotypes of mutants affected in Polα and Polε are similar to the mechanisms underlying gis5 phenotypes is currently unclear. First of all, the Polδ has two chances of interacting with specific nucleosomes and DNA bound proteins, first during the extension of Okazaki fragments and then during their maturation, distinguishing Polδ from Polα and Polε. Interestingly, hypomorphic alleles of POLA1 and POLE1 also led to higher SEP3 expression levels [11,16,18,19], raising the possibility that common mechanisms may produce the phenotypes of all DNA polymerase mutants. However, the role of epigenetic modifications at the SEP3 locus were neither investigated further nor were the epistatic interactions between the SEP3 locus and the polymerases alleles. Further, for both Polα and Polε it was proposed that their mutations affected the interaction with LIKE HETEROCHROMATIN 1 (LHP1) [11,16–19], a protein with H3K27me3 binding activity which is required to repress target genes [47,48], although some level of controversy remained on whether the proposed interactions were direct [17]. Protein modeling of the gis5 allele suggests that the A707V substitution is unlikely to change the direct interactions with other proteins, given that this residue is not solvent accessible and very close to the nucleotide binding site, favoring the interpretation that gis5 changes the dynamics of DNA replication rather than the recruitment of histone methylation complexes, which is supported by the expected movements of the finger domain α-helix that contains the A707V substitution. Obtaining analogous mutations to gis5 in DNA Polα and Polε catalytic subunits will likely shed light on the possible common mechanisms that replicative polymerases may use to reestablish epigenetic marks during DNA replication.
The presence of the SEP3-FT feedback loop and the possible interaction of gis5 with the SEP3 locus accounts for the specificity of gis5 effects. However, one remaining important question is whether the gis5 effects are widespread all over the genome. Despite we found epigenetic changes in other loci different from SEP3 (S9 Fig.), the relatively low number of genes whose expression is altered in gis5 mutants (81 with a two-fold difference with WT, S1 Table), supports the notion that the effects of gis5 are specific for a relatively low number of loci. As discussed above for the SEP3 locus, these effects in some specific loci could result from interactions that may occur during the maturation of Okazaki fragments between Polδ and DNA bound proteins, which are loaded immediately after the passage of the replication fork [46]. Noteworthy, specific effects of mutations in the catalytic domain of Polδ are not exclusive of plants. A high specific effect was also observed in humans; a Ser605 deletion in the Polδ catalytic site is lethal in homozygosis but heterozygous individuals showed unexpected tissue specific phenotypes: mandibular hypoplasia, deafness and progeroid features (MDP) syndrome [49]. Other mutations which affect the proofreading domains of human Polδ and Polε were associated to cancer susceptibility, which is consistent with the mutator phenotype expected for these alleles [23]. In contrast, the molecular basis for the Ser605-deletion-triggered MDP is currently unknown and there is no evidence supporting a mutator phenotype or an increase in cancer susceptibility [49]. Our work raises the possibility that an epigenetic change on a small subset of master regulators could also explain the apparent specificity of the MDP produced by deletion of Ser605 in humans, as we show here for SEP3 in plants. In the same line of reasoning, epigenetic effects could also be part of the equation in the progression of tumors bearing defective alleles of replicative DNA polymerases, which could add to the mutator phenotypes of these defective alleles [23]. We think that the characteristics of the gis5 allele will be invaluable in future studies on the interplay between the replication of the lagging strand, DNA replication stress, epigenetic inheritance and development in multicellular organisms.
Materials and Methods
Plant Material and Growth Conditions
All the alleles and transgenic lines used were obtained in the Columbia background: ft-10 (GABI_290E08) [34], tsf-3 (SALK_087522) [50], soc1–2 (SALK_006054) [51], co-9 (SAIL_24_HO4) [52], gi-2 (CS3397) [53], flc-201 (SALK_003346) [54], fca-9 [55] and fve-3 [56], recombination GUS reporter lines 1406 (direct repeat line) and 1415 (inverted repeat line) [57,58], P8.1kbFT:GUS [6], PCycB1;1:GUS [32], and transgenic lines expressing amiRNA-FT (artificial microRNAs) under the 35S, SUC2 and FD promoters [3]. Seeds were sterilized with chlorine in the vapour phase and, depending on the experiments, plants were grown on a 1 : 1:1 soil, vermiculite and perlite mix and every two weeks plants were fertilized with a 0.1% solution of Hakaphos (Compo Agricultura, http://www.compo.es), or on plates with MS salts medium (DUCHEFA). Plants were grown at 16, 18, 23, 24 and 28°C under LDs (16-h light/8-h dark), SDs (8-h light/16-h dark) or continuous light, with a light intensity of 80 μmolm-2s-1 produced by cool white fluorescent tubes.
Map-Based Cloning and Mutant Complementation
Seeds of the late flowering gi-2 background were mutagenized with ethyl methanesulfonate (EMS) in order to isolate early flowering, suppressors of gi-2 mutants. The gis5 gi-2 mutant was crossed with gi-5 (gi in an Arabidopsis Landsberg erecta accession) to generate the mapping population. About 600 F2 early flowering plants were used for fine mapping by analyzing recombination events using different molecular markers (InDels and dCAPS [26,59]). The gis5 mutation was mapped to chromosome 5 in a 120 kb interval between CER436434 and CER436454 markers. Sequencing revealed a C-to-T point mutation in the At5g63960 locus. For genetic analysis, the gis5 mutant was backcrossed to WT four times. A fragment of 10831bp, containing the full length of At5g63960, was released from the MBM17 BAC clone by using SalI and subcloned to the pPZP212 binary vector [60]. The construct was transformed into Agrobacterium tumefaciens strain GV3101, which was then used to transform gis5 mutants by floral-dipping as described [61]. The transformed seedlings were screened on MS salts plates, containing 50 mg L-1 kanamycin. Only homozygous, single-locus insertion lines were selected in the T3 generation and used for subsequent experiments. The primers used are described in S1 Text.
Protein Modeling
Protein structures 3IAY, that correspond to the crystal structure of the catalytic subunit of yeast Polδ in ternary complex with a template primer and an incoming nucleotide (closed conformation), 4FVM, that correspond to the catalytic subunit of yeast Polα in ternary complex with the template primer and the incoming nucleotide (closed conformation) and 4FYD, that correspond to the catalytic subunit of yeast Polα alone (open conformation), were used as templates and were obtained from the PDB website (http://www.rcsb.org/pdb/home/home.do).
Three-dimensional model of the GIS5 (wild-type and mutated) proteins were obtained by homology-modeling using Modeller V9.9 [62]. The stereochemical quality of the modelled structure was checked by assessment of the Ramachandran plot plot [63] with the rampage server (http://mordred.bioc.cam.ac.uk/~rapper/rampage.php), being 95.2% of the residues in the favoured regions. The analysis of the compatibility of the atomic model (3D) with its own amino acid sequence (1D) was performed with Verify3D [64]. Finally, the global superimposition between the template (3IAY) and the model has 881 equivalent positions with an rmsd of 0.43, without twists [65]. These parameters support the correctness of the model.
Genetic Analysis
Double mutants were obtained by crossing gis5 mutants with ft-10, tsf-3, co-9, gi-2, fve-3, fca-9, soc1–201 and flc-201 mutants. After F1 selfing, F2 progeny was secreened by phenotyping and genotyping and verification by PCR-based methods. Primers are listed in S1 Text.
Quantitative RT-PCR
Seedlings were frozen in liquid nitrogen and total RNA was prepared using a Plant Total RNA Mini Kit (YRP50; Real Biotech Corporation, http://www.real-biotech.com), and 1 μg was used to synthesize cDNA with M-MLV reverse transcriptase (Invitrogen, http://invitrogen.com), and used to quantitate UBQ10, SEP1-3, FT, FLC, RAD51 and BRCA1 expression with the Mx3005P real-time PCR system (Stratagene, http://www.genomics.agilent.com) in conjunction with SyBR Green I (Invitrogen). UBQ10 was used as a housekeeping gene to normalize gene expression [66]. Relative expression levels were determined using the comparative cycle threshold (Ct) method [67]. The primers used are described in S1 Text.
Microarray Experiments
ATH1 microarrays (Affymetrix) were used to compareWT and gis5 transcriptomes. Total RNA was isolated, as described above, from Col and gis5 10-d-old seedlings grown under continuous light at 24°C. The experimental design comprised three biological replicates of each genotype. Synthesis of cDNA, cRNA labelling and hybridizations were made according to Affymetrix protocols, and probe signal intensities were processed using the Affymetrix GeneChip operating software. The resulting cell intensity (CEL) files were analyzed for data quality control using the same software package. Subsequent normalization of the raw data and estimation of signal intensities were performed using ‘robust multi-chip average’ (RMA) [68] with the CARMAWeb web application (https://carmaweb.genome.tugraz.at). Genes with a P-value lower than 0.05 and fold changes representing log2 ratio≥1 (upregulated) or ≤−1 (down regulated) were considered to be differentially expressed. The data discussed in this publication have been deposited in NCBI's Gene Expression Omnibus [69].
ChIP Assays
Three 10 cm plates of 10 day-old plants (gis5 and Col) grown on MS agar under continuous light at 18 and 24°C were harvested and immersed in PBS supplemented with 1% formaldehyde. The seedlings were vacuum infiltrated for 20 min. Glycine was added to a final concentration of 0.1 M and incubated for 5 min. The seedlings were removed from the solution and frozen in liquid nitrogen. Approximately 2.0 g of seedlings were ground and resuspended in 25 ml NIB (50 mM HEPES [pH 7.4], 25 mM NaCl, 5 mM MgCl2, 5% sucrose, 30% glycerin, 0.25% Triton X-100, 0.1% beta-mercaptoethanol, 0.1% protease inhibitor cocktail (SIGMA P9599). After centrifugation at 2500 g for 20 min at 4°C, the nuclear pellet was resuspended and washed in NWB (17 mM HEPES [pH 7.4], 7 mM MgCl2, 33 mM NaCl, 13% sucrose, 13% glycerin, 0.25% Triton X-100, 0.1% beta-mercaptoethanol, 0.1% protease inhibitor cocktail). After centrifuging, the pellet was resuspended in 1mL TE buffer supplemented with 0.5% SDS and mixed on a rotator for 20 min at 4°C. The chromatin was diluted with TE buffer to a final SDS concentration of 0.25%. The DNA was sheared by sonication to approximately 500–1000 bp fragments. After centrifugation (10 min at 13,000 rpm, 4°C), approximately one tenth (4–6 μg of DNA) was mixed with RIPA dilution buffer (80 mM Tris-Hcl [pH 7.4], 230 mM NaCl, 1.7% NP40, 0.17% deoxycholate) in a 2 : 3 ratio and 1mM DTT, 0.5 μg/ml RNAse A, 0.2% proteinase inhibitor cocktail and 1,5 μl anti-H3K4me3 (Millipore, catalogue number: 07–473), anti-H3K27me3 (Millipore, catalogue number: 07–449) or anti-H3K9K14ac (Millipore, catalogue number: 06–599) were added. After overnight incubation with rotation at 4°C, the samples were cleared by centrifugation (14000rpm, 10 min, 4°C). A 30 μl aliquot of washed ProteinA-coupled agarose beads was added to the supernatant and the incubation continued on the rotating wheel for 1 hr at 4°C. The agarose beads were then washed with 5 times 1 mL of RIPA buffer (20 mM Tris-Hcl [pH 7.4], 140 mM NaCl, 1.0% NP40, 0.1% deoxycholate, 0.1% SDS). The immunocomplexes were eluted from the beads with two times 200 μl of glycine elution buffer (100 mM glycine, 500 mM NaCl, 0.05% Tween 20 [pH2.5]) and the combined elutes neutralized with 100 μl of 1 M Tris-HCl (pH 9.7). Crosslinks were reversed by incubation at 37°C for at least 6 hr in the presence of 60 μg/ml Proteinase K followed by at least 8 hr incubation at 65°C. The DNA was purified by two successive phenol/chloroform/isoamyl alcohol extractions and ethanol precipitation. Pellets were washed with 70% ethanol and resuspended in 100 μl of H2O; 4 μl were used for each q-PRC. All immunoprecipitations were quantified in comparison to an appropriate dilution of the input which was obtained by processing 10% of the supernatant of each NO-antibody precipitation (only beads) in parallel to the immunoprecipitated samples during the decrosslinking and DNA purification procedure. When indicated, data was relativized to a UBQ10 or FUS3 fragment. Each of the immunoprecipitations was performed 5–6 independent times. The primers used are described in S1 Text.
Histochemical GUS Assays
For HR frequency determination, we counted the number of GUS positive spots, each indicating a recombination event. The recombination reporter lines 1406 (direct repeat line) and 1415 (inverted repeat line) [57,58] were crossed with gis5. gis5 1406, gis5 1415, 1406 and 1415 plants were grown on MS salts plates under LD conditions at 18 and 24°C. At bolting, 15 plants for each genotype and condition were dissected, and the first true leaf of 12 individual plants was used for spot number determination. A picture of each first leaf was obtained under microscope and further analyzed with the ImageJ software for spot number determination. For FT tissue expression studies, the P8.1kbFTpro:GUS transgenic line [6] was crossed with gis5, and GUS assays were performed on 10 day-old gis5 P8.1kbFT:GUS and P8.1kbFT:GUS seedlings grown on MS salts plates. For CycB1 expression analysis gis5 was crossed with PCycB1;1-GUS reporter lines and GUS assays were performed as previously described [32].
amiRNA Constructs
The constructs directed against SEP1 and SEP3 genes were designed using WMD2 Web Micro RNA designer (http://wmd2.weigelworld.org/cgibin/mirnatools.pl; [70]). Overlapping PCR was used to replace MIR319a precursor by each microRNA and finally subcloned into pBI19 derived binary vectors for plant transformation. amiRNAs expression was driven by 35S (ectopic expression), SUC2 (expression in phloem companion cells) and FD (expression in the meristematic cells of the shoot apex). Transgenic lines were selected on medium supplemented with 50 μg mL-1 kanamycin. The primers used are described in S1 Text.
Accesion Numbers
Sequence data from this article can be found in GenBank/EMBL data libraries under accession numbers: At5g63960 (POLD1), At1g65480 (FT), At4g20370 (TSF), At2g45660 (SOC1), At5g15840 (CO), At1g22770 (GI), At5g10140 (FLC), At4g16280 (FCA) and At2g19520 (FVE). The transcriptome data can be found in GenBank (http://www.ncbi.nlm.nih.gov/geo) under Gene Expression Omnibus accession number GSE58036.
Supporting Information
Zdroje
1. Corbesier L, Vincent C, Jang S, Fornara F, Fan Q, et al. (2007) FT protein movement contributes to long-distance signaling in floral induction of Arabidopsis. Science 316 : 1030–1033. 17446353
2. Jaeger KE, Wigge PA (2007) FT protein acts as a long-range signal in Arabidopsis. Curr Biol 17 : 1050–1054. 17540569
3. Mathieu J, Warthmann N, Kuttner F, Schmid M (2007) Export of FT protein from phloem companion cells is sufficient for floral induction in Arabidopsis. Curr Biol 17 : 1055–1060. 17540570
4. Kim DH, Doyle MR, Sung S, Amasino RM (2009) Vernalization: winter and the timing of flowering in plants. Annu Rev Cell Dev Biol 25 : 277–299. doi: 10.1146/annurev.cellbio.042308.113411 19575660
5. Andres F, Coupland G (2012) The genetic basis of flowering responses to seasonal cues. Nat Rev Genet 13 : 627–639. doi: 10.1038/nrg3291 22898651
6. Adrian J, Farrona S, Reimer JJ, Albani MC, Coupland G, et al. (2010) cis-Regulatory elements and chromatin state coordinately control temporal and spatial expression of FLOWERING LOCUS T in Arabidopsis. Plant Cell 22 : 1425–1440. doi: 10.1105/tpc.110.074682 20472817
7. Farrona S, Thorpe FL, Engelhorn J, Adrian J, Dong X, et al. (2011) Tissue-specific expression of FLOWERING LOCUS T in Arabidopsis is maintained independently of polycomb group protein repression. Plant Cell 23 : 3204–3214. doi: 10.1105/tpc.111.087809 21917549
8. Jeong JH, Song HR, Ko JH, Jeong YM, Kwon YE, et al. (2009) Repression of FLOWERING LOCUS T chromatin by functionally redundant histone H3 lysine 4 demethylases in Arabidopsis. PloS One 4: e8033. doi: 10.1371/journal.pone.0008033 19946624
9. Jiang D, Wang Y, He Y (2008) Repression of FLOWERING LOCUS C and FLOWERING LOCUS T by the Arabidopsis Polycomb repressive complex 2 components. PloS One 3: e3404. doi: 10.1371/journal.pone.0003404 18852898
10. Wang Y, Gu X, Yuan W, Schmitz RJ, He Y (2014) Photoperiodic Control of the Floral Transition through a Distinct Polycomb Repressive Complex. Dev Cell 28 : 727–736. doi: 10.1016/j.devcel.2014.01.029 24613395
11. Barrero JM, Gonzalez-Bayon R, del Pozo JC, Ponce MR, Micol JL (2007) INCURVATA2 encodes the catalytic subunit of DNA Polymerase alpha and interacts with genes involved in chromatin-mediated cellular memory in Arabidopsis thaliana. Plant Cell 19 : 2822–2838. 17873092
12. Goodrich J, Puangsomlee P, Martin M, Long D, Meyerowitz EM, et al. (1997) A Polycomb-group gene regulates homeotic gene expression in Arabidopsis. Nature 386 : 44–51. 9052779
13. Kotake T, Takada S, Nakahigashi K, Ohto M, Goto K (2003) Arabidopsis TERMINAL FLOWER 2 gene encodes a heterochromatin protein 1 homolog and represses both FLOWERING LOCUS T to regulate flowering time and several floral homeotic genes. Plant Cell Physiol 44 : 555–564. 12826620
14. Burgers PM (2009) Polymerase dynamics at the eukaryotic DNA replication fork. J Biol Chem 284 : 4041–4045. doi: 10.1074/jbc.R800062200 18835809
15. Li F, Martienssen R, Cande WZ (2011) Coordination of DNA replication and histone modification by the Rik1-Dos2 complex. Nature 475 : 244–248. doi: 10.1038/nature10161 21725325
16. del Olmo I, Lopez-Gonzalez L, Martin-Trillo MM, Martinez-Zapater JM, Pineiro M, et al. (2010) EARLY IN SHORT DAYS 7 (ESD7) encodes the catalytic subunit of DNA polymerase epsilon and is required for flowering repression through a mechanism involving epigenetic gene silencing. Plant J 61 : 623–636. doi: 10.1111/j.1365-313X.2009.04093.x 19947980
17. Hyun Y, Yun H, Park K, Ohr H, Lee O, et al. (2013) The catalytic subunit of Arabidopsis DNA polymerase alpha ensures stable maintenance of histone modification. Development 140 : 156–166. doi: 10.1242/dev.084624 23154417
18. Liu J, Ren X, Yin H, Wang Y, Xia R, et al. (2010) Mutation in the catalytic subunit of DNA polymerase alpha influences transcriptional gene silencing and homologous recombination in Arabidopsis. Plant J 61 : 36–45. doi: 10.1111/j.1365-313X.2009.04026.x 19769574
19. Yin H, Zhang X, Liu J, Wang Y, He J, et al. (2009) Epigenetic regulation, somatic homologous recombination, and abscisic acid signaling are influenced by DNA polymerase epsilon mutation in Arabidopsis. Plant Cell 21 : 386–402. doi: 10.1105/tpc.108.061549 19244142
20. Branzei D, Foiani M (2010) Maintaining genome stability at the replication fork. Nat Rev Mol Cell Biol 11 : 208–219. doi: 10.1038/nrm2852 20177396
21. Prindle MJ, Loeb LA (2012) DNA polymerase delta in DNA replication and genome maintenance. Env Mol Mutag 53 : 666–682.
22. Schuermann D, Molinier J, Fritsch O, Hohn B (2005) The dual nature of homologous recombination in plants. Trends Genet 21 : 172–181. 15734576
23. Palles C, Cazier JB, Howarth KM, Domingo E, Jones AM, et al. (2013) Germline mutations affecting the proofreading domains of POLE and POLD1 predispose to colorectal adenomas and carcinomas. Nat Genet 45 : 136–144. doi: 10.1038/ng.2503 23263490
24. Jenik PD, Jurkuta RE, Barton MK (2005) Interactions between the cell cycle and embryonic patterning in Arabidopsis uncovered by a mutation in DNA polymerase epsilon. Plant Cell 17 : 3362–3377. 16278345
25. Ronceret A, Guilleminot J, Lincker F, Gadea-Vacas J, Delorme V, et al. (2005) Genetic analysis of two Arabidopsis DNA polymerase epsilon subunits during early embryogenesis. Plant J 44 : 223–236. 16212602
26. Jander G, Norris SR, Rounsley SD, Bush DF, Levin IM, et al. (2002) Arabidopsis map-based cloning in the post-genome era. Plant Physiol 129 : 440–450. 12068090
27. Swan MK, Johnson RE, Prakash L, Prakash S, Aggarwal AK (2009) Structural basis of high-fidelity DNA synthesis by yeast DNA polymerase delta. Nat Struct & Mol Biol 16 : 979–986. doi: 10.1038/nsmb.2941 25580578
28. Mullins JG (2012) Structural modelling pipelines in next generation sequencing projects. Adv Protein Chem Struct Biol 89 : 117–167. doi: 10.1016/B978-0-12-394287-6.00005-7 23046884
29. Rothwell PJ, Waksman G (2005) Structure and mechanism of DNA polymerases. Adv Protein Chem 71 : 401–440. 16230118
30. Petsko GA, Ringe D (2004) Protein Structure and Function: New Science Press. 25057686
31. Schuermann D, Fritsch O, Lucht JM, Hohn B (2009) Replication stress leads to genome instabilities in Arabidopsis DNA polymerase delta mutants. Plant Cell 21 : 2700–2714. doi: 10.1105/tpc.109.069682 19789281
32. Colon-Carmona A, You R, Haimovitch-Gal T, Doerner P (1999) Technical advance: spatio-temporal analysis of mitotic activity with a labile cyclin-GUS fusion protein. Plant J 20 : 503–508. 10607302
33. Blazquez MA, Ahn JH, Weigel D (2003) A thermosensory pathway controlling flowering time in Arabidopsis thaliana. Nat Genet 33 : 168–171. 12548286
34. Yoo SK, Chung KS, Kim J, Lee JH, Hong SM, et al. (2005) CONSTANS activates SUPPRESSOR OF OVEREXPRESSION OF CONSTANS 1 through FLOWERING LOCUS T to promote flowering in Arabidopsis. Plant Physiol 139 : 770–778. 16183837
35. Teper-Bamnolker P, Samach A (2005) The flowering integrator FT regulates SEPALLATA3 and FRUITFULL accumulation in Arabidopsis leaves. Plant Cell 17 : 2661–2675. 16155177
36. Castillejo C, Romera-Branchat M, Pelaz S (2005) A new role of the Arabidopsis SEPALLATA3 gene revealed by its constitutive expression. Plant J 43 : 586–596. 16098111
37. Honma T, Goto K (2001) Complexes of MADS-box proteins are sufficient to convert leaves into floral organs. Nature 409 : 525–529. 11206550
38. Lopez-Vernaza M, Yang S, Muller R, Thorpe F, de Leau E, et al. (2012) Antagonistic roles of SEPALLATA3, FT and FLC genes as targets of the polycomb group gene CURLY LEAF. PloS One 7: e30715. doi: 10.1371/journal.pone.0030715 22363474
39. Hwan Lee J, Joon Kim J, Ahn JH (2012) Role of SEPALLATA3 (SEP3) as a downstream gene of miR156-SPL3-FT circuitry in ambient temperature-responsive flowering. Plant Signal Behav 7 : 1151–1154. doi: 10.4161/psb.21366 22899051
40. Liu C, Xi W, Shen L, Tan C, Yu H (2009) Regulation of floral patterning by flowering time genes. Dev Cell 16 : 711–722. doi: 10.1016/j.devcel.2009.03.011 19460347
41. Kim JM, To TK, Ishida J, Matsui A, Kimura H, et al. (2012) Transition of chromatin status during the process of recovery from drought stress in Arabidopsis thaliana. Plant Cell Physiol 53 : 847–856. doi: 10.1093/pcp/pcs053 22505693
42. Kumar SV, Wigge PA (2010) H2A.Z-containing nucleosomes mediate the thermosensory response in Arabidopsis. Cell 140 : 136–147. doi: 10.1016/j.cell.2009.11.006 20079334
43. Liu C, Zhou J, Bracha-Drori K, Yalovsky S, Ito T, et al. (2007) Specification of Arabidopsis floral meristem identity by repression of flowering time genes. Development 134 : 1901–1910. 17428825
44. Ding Y, Fromm M, Avramova Z (2012) Multiple exposures to drought ‘train’ transcriptional responses in Arabidopsis. Nat Comm 3 : 740.
45. Muramoto T, Muller I, Thomas G, Melvin A, Chubb JR (2010) Methylation of H3K4 Is required for inheritance of active transcriptional states. Curr Biol 20 : 397–406. doi: 10.1016/j.cub.2010.01.017 20188556
46. Smith DJ, Whitehouse I (2012) Intrinsic coupling of lagging-strand synthesis to chromatin assembly. Nature 483 : 434–438. doi: 10.1038/nature10895 22419157
47. Turck F, Roudier F, Farrona S, Martin-Magniette ML, Guillaume E, et al. (2007) Arabidopsis TFL2/LHP1 specifically associates with genes marked by trimethylation of histone H3 lysine 27. PLoS Genet 3: e86. 17542647
48. Zhang X, Germann S, Blus BJ, Khorasanizadeh S, Gaudin V, et al. (2007) The Arabidopsis LHP1 protein colocalizes with histone H3 Lys27 trimethylation. Nat Struct & Mol Biol 14 : 869–871. doi: 10.1038/nsmb.2941 25580578
49. Weedon MN, Ellard S, Prindle MJ, Caswell R, Lango Allen H, et al. (2013) An in-frame deletion at the polymerase active site of POLD1 causes a multisystem disorder with lipodystrophy. Nat Genet 45 : 947–950. doi: 10.1038/ng.2670 23770608
50. Yamaguchi A, Kobayashi Y, Goto K, Abe M, Araki T (2005) TWIN SISTER OF FT (TSF) acts as a floral pathway integrator redundantly with FT. Plant Cell Physiol 46 : 1175–1189. 15951566
51. Alonso JM, Stepanova AN, Leisse TJ, Kim CJ, Chen H, et al. (2003) Genome-wide insertional mutagenesis of Arabidopsis thaliana. Science 301 : 653–657. 12893945
52. Balasubramanian S, Sureshkumar S, Lempe J, Weigel D (2006) Potent induction of Arabidopsis thaliana flowering by elevated growth temperature. PLoS Genet 2: e106. 16839183
53. Redei GP (1962) Supervital Mutants of Arabidopsis. Genetics 47 : 443–460. 17248096
54. Strasser B, Alvarez MJ, Califano A, Cerdan PD (2009) A complementary role for ELF3 and TFL1 in the regulation of flowering time by ambient temperature. Plant J 58 : 629–640. doi: 10.1111/j.1365-313X.2009.03811.x 19187043
55. Page T, Macknight R, Yang CH, Dean C (1999) Genetic interactions of the Arabidopsis flowering time gene FCA, with genes regulating floral initiation. Plant J 17 : 231–239. 10097382
56. Ausin I, Alonso-Blanco C, Jarillo JA, Ruiz-Garcia L, Martinez-Zapater JM (2004) Regulation of flowering time by FVE, a retinoblastoma-associated protein. Nat Genet 36 : 162–166. 14745447
57. Gherbi H, Gallego ME, Jalut N, Lucht JM, Hohn B, et al. (2001) Homologous recombination in planta is stimulated in the absence of Rad50. EMBO Rep 2 : 287–291. 11306548
58. Swoboda P, Gal S, Hohn B, Puchta H (1994) Intrachromosomal homologous recombination in whole plants. EMBO J 13 : 484–489. 8313893
59. Jander G (2006) Gene identification and cloning by molecular marker mapping. Methods Mol Biol 323 : 115–126. 16739572
60. Hajdukiewicz P, Svab Z, Maliga P (1994) The small, versatile pPZP family of Agrobacterium binary vectors for plant transformation. Plant Mol Biol 25 : 989–994. 7919218
61. Clough SJ, Bent AF (1998) Floral dip: a simplified method for Agrobacterium-mediated transformation of Arabidopsis thaliana. Plant J 16 : 735–743. 10069079
62. Eswar N, Webb B, Marti-Renom MA, Madhusudhan MS, Eramian D, et al. (2006) Comparative protein structure modeling using Modeller. Curr Protoc Bioinformatics Chapter 5: Unit 5 6. doi: 10.1002/0471250953.bi0907s13 18428773
63. Ramachandran GN, Ramakrishnan C, Sasisekharan V (1963) Stereochemistry of polypeptide chain configurations. J Mol Biol 7 : 95–99. 13990617
64. Luthy R, Bowie JU, Eisenberg D (1992) Assessment of protein models with three-dimensional profiles. Nature 356 : 83–85. 1538787
65. Ye Y, Godzik A (2003) Flexible structure alignment by chaining aligned fragment pairs allowing twists. Bioinformatics 19 Suppl 2: ii246–255. 14534198
66. Czechowski T, Stitt M, Altmann T, Udvardi MK, Scheible WR (2005) Genome-wide identification and testing of superior reference genes for transcript normalization in Arabidopsis. Plant Physiol 139 : 5–17. 16166256
67. Larionov A, Krause A, Miller W (2005) A standard curve based method for relative real time PCR data processing. BMC Bioinformatics 6 : 62. 15780134
68. Bolstad BM, Irizarry RA, Astrand M, Speed TP (2003) A comparison of normalization methods for high density oligonucleotide array data based on variance and bias. Bioinformatics 19 : 185–193. 12538238
69. Edgar R, Domrachev M, Lash AE (2002) Gene Expression Omnibus: NCBI gene expression and hybridization array data repository. Nucleic Acids Res 30 : 207–210. 11752295
70. Ossowski S, Schwab R, Weigel D (2008) Gene silencing in plants using artificial microRNAs and other small RNAs. Plant J 53 : 674–690. doi: 10.1111/j.1365-313X.2007.03328.x 18269576
71. Palanivelu P (2013) DNA Polymerases: An Insight into Their Active Sites and Catalytic Mechanism. Int J Biochem Res Rev 3 : 42.
Štítky
Genetika Reprodukčná medicínaČlánok vyšiel v časopise
PLOS Genetics
2015 Číslo 2
- Gynekologové a odborníci na reprodukční medicínu se sejdou na prvním virtuálním summitu
- Je „freeze-all“ pro všechny? Odborníci na fertilitu diskutovali na virtuálním summitu
Najčítanejšie v tomto čísle
- Genomic Selection and Association Mapping in Rice (): Effect of Trait Genetic Architecture, Training Population Composition, Marker Number and Statistical Model on Accuracy of Rice Genomic Selection in Elite, Tropical Rice Breeding Lines
- Discovery of Transcription Factors and Regulatory Regions Driving Tumor Development by ATAC-seq and FAIRE-seq Open Chromatin Profiling
- Evolutionary Signatures amongst Disease Genes Permit Novel Methods for Gene Prioritization and Construction of Informative Gene-Based Networks
- Proteotoxic Stress Induces Phosphorylation of p62/SQSTM1 by ULK1 to Regulate Selective Autophagic Clearance of Protein Aggregates