
Proteasomes, Sir2, and Hxk2 Form an Interconnected Aging Network That Impinges on the AMPK/Snf1-Regulated Transcriptional Repressor Mig1
Advanced cellular age is associated with decreased efficiency of the proteostasis network. The proteasome, a protease in the cytoplasm and nuclei of eukaryotic cells, is an important component of this network. Recent studies demonstrate that increased proteasome capacity has a positive impact on longevity. The underlying mechanisms, however, have not been fully identified. Here we report that proteasomes are involved in regulating the AMP-activated kinase (AMPK) pathway and thus participate in correct metabolic adaptation. We find that Mig1, a transcriptional repressor downstream of yeast AMPK, Snf1, is a proteasome target and a negative regulator of lifespan. Increased proteasome activity results in enhanced turnover and incorrect localization of Mig1. The reduced Mig1 levels result in the induction of respiration and upregulation of the oxidative stress response. Premature Mig1 inactivation is also observed in two additional long-lived strains that overexpress SIR2 or are deleted for HXK2 and lifespan extension in both strains requires correct proteasome function. Our results uncover an interconnected network comprised of the proteasome, Sir2 and AMPK/Hxk2 signaling that impacts longevity through regulation of Mig1 and modulates respiratory metabolism. Mechanistic information on the cross-communication between these pathways is expected to facilitate the identification of novel pro-aging interventions.
Published in the journal:
Proteasomes, Sir2, and Hxk2 Form an Interconnected Aging Network That Impinges on the AMPK/Snf1-Regulated Transcriptional Repressor Mig1. PLoS Genet 11(1): e32767. doi:10.1371/journal.pgen.1004968
Category:
Research Article
doi:
https://doi.org/10.1371/journal.pgen.1004968
Summary
Advanced cellular age is associated with decreased efficiency of the proteostasis network. The proteasome, a protease in the cytoplasm and nuclei of eukaryotic cells, is an important component of this network. Recent studies demonstrate that increased proteasome capacity has a positive impact on longevity. The underlying mechanisms, however, have not been fully identified. Here we report that proteasomes are involved in regulating the AMP-activated kinase (AMPK) pathway and thus participate in correct metabolic adaptation. We find that Mig1, a transcriptional repressor downstream of yeast AMPK, Snf1, is a proteasome target and a negative regulator of lifespan. Increased proteasome activity results in enhanced turnover and incorrect localization of Mig1. The reduced Mig1 levels result in the induction of respiration and upregulation of the oxidative stress response. Premature Mig1 inactivation is also observed in two additional long-lived strains that overexpress SIR2 or are deleted for HXK2 and lifespan extension in both strains requires correct proteasome function. Our results uncover an interconnected network comprised of the proteasome, Sir2 and AMPK/Hxk2 signaling that impacts longevity through regulation of Mig1 and modulates respiratory metabolism. Mechanistic information on the cross-communication between these pathways is expected to facilitate the identification of novel pro-aging interventions.
Introduction
Many genetic and pharmacological interventions that affect lifespan in model organisms modulate the respiratory capacity of the mitochondria and change the metabolic status of cells. The conserved pro-longevity effects of caloric restriction (CR) have been related to optimal mitochondrial function [1, 2, 3]. Paradoxically, however, mitochondria are the main source for reactive oxygen species (ROS) that covalently modify and inactivate cellular macromolecules. ROS-induced damage to proteins, lipids and nucleotides has been proposed to drive the age-induced decline in cellular function and is closely linked to a range of age-related chronic disease states. Yet strategies to reduce ROS have led to inconclusive effects on lifespan in different model organisms. On the other hand, several recent reports indicate that a moderate increase in ROS production in response to increased respiration activates a stress response that has a beneficial impact on lifespan [1, 4, 5, 6, 7]. This has given rise to the mitohormesis hypothesis, which posits that a low dose oxidative stress induced by increased respiratory activity has a beneficial impact on longevity.
Pathways that regulate respiration, the metabolic state and the cellular stress response play a pivotal role in the aging process. The target of rapamycin (TOR) pathway is involved in regulating the cellular response to nutrients, and has a well-studied role in the regulation of lifespan. In fact, apart from CR, treating cells with the TORC1 inhibitor rapamycin is the most successful pharmacological intervention to date that promotes longevity [8, 9, 10, 11]. TORC1 is active under optimal growth conditions and promotes ribosome biogenesis, protein translation, and cell growth. TORC1 activity is antagonized by the AMPK/Snf1 signaling pathway. While TORC1 signaling is inhibited upon nutrient limitation and stress, AMPK/Snf1s are activated by these conditions [12] AMPK also plays an active role in the termination of TORC1 signaling. Many of the cellular consequences of TOR inactivation are directly regulated by the activity of AMPKs, such as phosphorylation of transcriptional regulators involved in optimizing mitochondrial function and stress tolerance [13, 14] or the induction of autophagy via ULK1 phosphorylation [15]. Since AMPKs serve as fuel gauges and are highly conserved in eukaryotic cells [16] they are primed to play an important role in longevity and the cellular response to CR [17]. The impact of AMPK on longevity in mammals, however, is largely unexplored [17]. Several previous studies in different model organisms support the hypothesis that AMPK/Snf1 activation positively impacts lifespan [18]. In C. elegans, overexpression of the worm ortholog AAK-2 promotes lifespan extension [19] and AMPK activity is increased under CR conditions [1]. Tissue-specific knock-down of the Drosophila ortholog decreased lifespan [20]. However, findings in yeast remain controversial with Snf1 either promoting or decreasing lifespan [2, 21, 22]. Clearly, additional studies are required to elucidate the precise role of AMPKs in aging cells.
The cellular response induced by increased respiration and oxidative stress includes repair systems such as antioxidant enzymes, DNA-repair pathways, chaperones and the proteolytic systems. Importantly, genetic upregulation of many of these systems can extend lifespan in different organisms. As essential arms of the cellular stress response, the proteolytic systems prevent the accumulation of aggregation prone proteins and recycle amino acids for new synthesis. The proteasome is the primary protease in the cytoplasm and nuclei of eukaryotic cells [23]. Several recent studies demonstrated that improved proteolytic capacity through genetic upregulation of the proteasome increases lifespan. Using Saccharomyces cerevisiae as a model system we characterized the replicative lifespan (RLS) of cells with increased or decreased proteasome pools and found a positive correlation between proteasome activity and replicative lifespan in yeast [24]. Beneficial effects on lifespan and stress response upon upregulation of individual proteasome subunits were also observed in C. elegans and Drosophila [25, 26]. Furthermore, all exceptionally long-lived organisms examined exhibit increased proteasome activity [27, 28, 29].
The underlying mechanisms for proteasome-mediated lifespan extension remain to be elucidated. We found that the increased lifespan in cells with elevated proteasome activity correlated with improved tolerance towards proteotoxic stress and reduced aggregation of a neurotoxic protein expressed in yeast [24]. Additionally, a recent study reported reduced aggregation of endogenous proteins in aged mother cells upon upregulation of proteasome activity [30]. Thus, the beneficial impact of increased proteasomal activity on longevity is at least partially related to improved protein homeostasis. Yet, proteasomes influence cellular functions at many levels. In addition to being an essential component of the proteostasis, network they also regulate a large number of pathways through the timed degradation of proteins relevant to signal transduction and gene transcription in eukaryotic cells [31].
Here we report that the proteasome is involved in regulating AMPK/Snf1 signaling and that this activity impacts longevity in S. cerevisiae. Components of the Snf1 pathway are required for the pro-longevity effect in cells with elevated proteasome capacity. These cells exhibit decreased levels of Mig1, the major Snf1-regulated transcriptional repressor that prevents the expression of genes required for the induction of respiration under optimal growth conditions. In addition, Mig1 is relocalized to the mitochondria. Consistent with reduced Mig1 activity, signature genes, normally repressed by Mig1 under favorite growth conditions, are induced in cells with elevated proteasome activity resulting in increased respiratory capacity. We propose that the premature increase in respiration induces a hormetic response that contributes to lifespan extension in cells with increased proteasome activity. However, complete loss of Mig1 in cells with increased proteasome activity abrogates proteasome-mediated lifespan extension, suggesting that in addition to repression of genes required for respiration, Mig1 must have an additional function during respiratory growth that positively contributes to longevity. This hypothesis is supported by the observation that a MIG1 mutant that is unable to exit the nucleus exhibits a short lifespan and prevents proteasome-mediated lifespan extension. Since we observed co-localization of Mig1 with mitochondria and increased mitochondrial fragmentation in the absence of Mig1, we propose that cytoplasmic Mig1 positively impacts respiration. MIG1 deletion also abrogated lifespan extension conferred by overexpression of SIR2, emphasizing that AMPK/Snf1 signaling impinges on other longevity pathways. Lastly, reduced proteasome activity prevented lifespan extension in SIR2 overexpressing strains and in a genetic model for caloric restriction through deletion of HXK2. Collectively, the results obtained provide evidence for an interconnected aging network formed by the proteasome, AMPK/Hxk2 signaling and Sir2 that impinges on Mig1 to regulate respiration and thus longevity.
Results
Proteasome-mediated lifespan extension is attenuated under growth conditions that restrict cells to either fermentative or respiratory metabolism
Deletion of the proteasome-related transcription factor RPN4 results in cells with a low, non-adaptive proteasome pool [32], while loss of the ubiquitin ligase Ubr2 has the opposite effect because Ubr2 marks Rpn4 for proteasomal degradation [24]. Cells with increased proteasome activity (ubr2Δ) exhibit increased replicative lifespan (RLS), while a reduction in proteasome levels (rpn4Δ or rpn4Δ ubr2Δ) reduces RLS (Fig. 1A) [24]. To explore proteasome-mediated effects on longevity under different environmental conditions, we compared the lifespan of proteasome mutants on carbon sources that induce different ratios of fermentation versus respiration. While glucose leads to ATP production largely through fermentation, glycerol fully induces respiratory metabolism. A more balanced ratio of fermentation and respiration is observed in cells grown on galactose and raffinose [14]. Interestingly, carbon sources that induce respiratory metabolism blunted the RLS differences observed in proteasome mutants. Mean lifespan extension in ubr2Δ cells relative to wild type on glucose was 37%, on galactose 29%, on raffinose 23% and on glycerol 26% (Fig. 1A–D). Thus, lifespan extension was lower on carbon sources that prevent fermentation. Similarly, the lifespan shortening observed in rpn4Δ cells was largely attenuated on media that enforce respiration (Fig. 1A–D).

Based on these findings, we speculated lifespan extension by ubr2Δ would be maximized in rho0 cells, which lack the mitochondrial genome and the ability to respire as a result, since these cells are forced to ferment. In contrast, lifespan extension was reduced in this background (only 19% mean RLS extension). (Fig. 1C, right panel). Interestingly, rpn4Δ cells were not short-lived in this context, indicating that impaired proteasome function is not an impediment to longevity in cells unable to respire. These results suggest that increased proteasome activity is advantageous under growth conditions that allow both fermentation and respiration, where the cell may dynamically shift between modes of metabolism. These observations point to a link between proteasome-mediated lifespan extension and respiratory metabolism.
Altered proteasome abundance impacts mitochondrial morphology and respiratory capacity
Proteasomes provide a quality control function at the outer membrane of the mitochondria by degrading damaged mitochondrial proteins [33]. Furthermore, proteasomal degradation is required for the regulation of mitochondrial morphological changes. Proteasomal degradation of mitofusins/Fzo1 prevents a hyperfused network and excessive fission under oxidative stress is prevented via Drp1/Dnm1 degradation [34, 35, 36, 37]. Given the variation of proteasome mutant RLSs under different metabolic conditions we investigated the morphology and activity of mitochondria. We visualized the mitochondrial network in cells with elevated or decreased proteasome capacity. We observed increased fragmentation in ubr2Δ cells and increased fusion in rpn4Δ cells both in glucose (Fig. 2A) and galactose (S1 Fig.). The morphological differences in the mitochondrial network in cells with increased or decreased proteasome activity correlate with Fzo1 levels, consistent with previous reports [34, 35, 38]. Decreased Fzo1 abundance was observed in cells with elevated proteasome activity, while reduced proteasome abundance resulted in increased Fzo1 levels (S2A Fig.).

Deletion of FZO1 results in loss of mitochondrial DNA and negatively impacts the respiratory capacity of cells [39]. To test the respiratory state of ubr2Δ or rpn4Δ and rpn4Δ ubr2Δ cells, we analyzed O2 consumption of cells grown in galactose or lactate in an Oroboros respirometer, which records mitochondrial oxygen consumption [40]. Growth on galactose induces an intermediary metabolic state with roughly equal contributions from glycolysis and respiration, while cells grown on lactose exclusively respire [14]. Respiration was measured at basal levels as well as in the presence of m-chlorophenyl hydrazone (CCCP) and triethyltin bromide (TET). Addition of CCCP dissipates the proton gradient across the mitochondrial membrane, which has a crucial function in regulating the capacity of respiratory chain complexes. Removing the membrane potential by addition of CCCP allows for the recording of maximum respiration. Respiration was also measured in the presence of the ATP-synthase inhibitor triethyltin bromide (TET), which assesses non-phosphorylating respiration caused by proton leakage across the inner mitochondrial membrane (LEAK flux). From these data, we calculated an in vivo respiratory state value (RSV; [41]) in cells grown in galactose. Contrary to our expectation based on the fragmented mitochondrial phenotype, we found that cells lacking UBR2 exhibit a ~ 30% increase in respiratory chain activity, while deletion of RPN4 led to a reduction in respiration (Fig. 2B). In the presence of lactate, however, proteasome mutants only marginally affected respiratory capacity (S2B Fig.), presumably because cells grown on lactate exhibit already maximum induction of respiratory metabolism. These findings indicate that loss of UBR2 does not affect the maximal respiratory capacity but instead shifts cells toward respiratory metabolism in environments where cells normally rely on both metabolic sources of ATP. In contrast, the non-adaptable proteasome pool in the rpn4∆ mutant skews metabolism away from respiration.
A typical response in yeast after cells switch from fermentation to respiration is the rapid nuclear accumulation of the stress and nutrient responsive transcription factor Msn2 [42], since this metabolic switch results in oxidative stress due to increased respiratory chain activity. We therefore reasoned that the increased respiratory activity of ubr2Δ cells should lead to increased nuclear localization of Msn2. In agreement with this hypothesis, we observed that ~ 50% of cells grown under fermentation conditions displayed nuclear localization of Msn2 (S3 Fig.). In addition, the ubr2Δ strain exhibits the induction of genes such as SUC2, HXK1 and GAL1 that are typically derepressed upon glucose withdrawal, while the rpn4Δ strain exhibited reduced expression of these genes (Fig. 3). These data corroborate that cells with more proteasome activity exhibit a metabolic shift towards respiratory metabolism.

Since increased respiratory capacity was found under growth conditions that also promote efficient lifespan extension, we conclude that the ability to prematurely activate respiration might be an important component of proteasome-mediated effects on lifespan. Our results furthermore suggest that proteasome-mediated lifespan extension does not originate from imbalanced mitochondrial dynamics. We therefore speculated that increased or decreased proteasome activity might regulate signaling pathways that control metabolic adaptation.
AMP-kinase/Snf1 signaling is involved in proteasome-mediated lifespan extension
The metabolic switch from fermentation to respiration is mediated by the AMPK signaling pathway [43]. Deregulation of that pathway in response to varying proteasome activity could be causative for the premature induction of respiration in cells with increased proteasome activity. This hypothesis predicts that cells deleted for sucrose non-fermenting 1 kinase (Snf1), the AMP-activated kinase in yeast, should attenuate proteasome-mediated lifespan extension. Loss of SNF1 in cells with increased proteasome abundance indeed abrogates the positive impact on lifespan in ubr2Δ cells to a large extent (Fig. 4A, left panel). We furthermore observed intensive genetic interaction between proteasome mutants and cells devoid of SNF1 (S4 Fig.). Interestingly, the snf1Δrpn4Δ double mutant exhibits a synthetic growth defect (S4B Fig.) that likely underlies its extremely short lifespan.

To obtain additional information on the impact of the Snf1 pathway on proteasome-mediated effects on lifespan, we tested whether other subunits of the heterotrimeric AMPK/Snf1 complex contribute to proteasome-mediated lifespan extension. The α-subunit Snf4 activates the catalytic Snf1 γ-subunit [43]. Although we observed a mild increase in lifespan upon deletion of SNF1 in our background (Fig. 4A), we found that loss of SNF4 led to a reduction in lifespan (Fig. 4B), consistent with mammalian reports that Snf1 activation has a beneficial impact on longevity [44]. The inconsistent RLS results observed for snf1Δ (Fig. 4A) and snf4Δ (Fig. 4B) cells might be caused by metabolic adaptations in the absence of SNF1 as snf1Δ cells are unable to respire (S4B Fig.), in contrast to snf4Δ cells that do not exhibit growth defects on non-fermentable carbon sources. For proteasome-mediated lifespan extension, however, both proteins are required, as loss of SNF4 almost completely abrogated lifespan extension by ubr2Δ (Fig. 4B).
Sip2 and Gal83 are Snf1 β-subunits that regulate the localization of the Snf1 complex [45]. Sip2 has recently been implicated in Snf1-mediated effects on lifespan [21]. We find, in agreement with Ashrafi et al. [21], that sip2Δ cells exhibit a slightly shortened lifespan, but loss of this subunit does not affect proteasome-mediated lifespan extension (S4A Fig., right panel). Similar to Sip2, deletion of GAL83, also shortens lifespan, but is not required for ubr2Δ-mediated lifespan extension (S4A Fig., left panel). A potential impact of these factors on proteasome-mediated lifespan extension could have been masked by redundancy among β-subunits [46].
Snf1-regulated transcriptional repressors are required for proteasome-mediated lifespan extension
The AMPK/Snf1 regulated metabolic switch from fermentation to respiration is induced by a tightly controlled set of transcriptional regulators that repress or derepress genes in response to carbon source availability [47]. The function of many transcription factors is regulated by proteasomal degradation [31]. We therefore speculated that the positive impact of elevated proteasome levels on lifespan might be caused by increased degradation of a negative regulator of lifespan and component of the Snf1 signaling pathway. The primary downstream effectors of Snf1 are the transcriptional repressors Mig1 and Mig2 [48], homologs of the transcriptional repressors Wilm’s Tumor protein 1 (WT1) and Krüppel-like factor 16 (KLF16) in mammals [49]. In media with abundant glucose, Mig1 and Mig2 repress genes that promote oxidative metabolism and ATP generation through respiration. Upon glucose depletion or on media with non-fermentable carbon sources, Snf1 is activated and phosphorylates nuclear Mig1 and Mig2, which results in nuclear export causing derepression of genes required for the metabolic switch [50]. Since the Snf1-regulated transcription factors are required for modulating metabolism, we tested whether deletion of these genes has an impact on lifespan. Neither loss of MIG1 nor loss of MIG2 per se had a strong impact on lifespan in the genetic background used here (Fig. 4C, D), nor was redundancy evident from the lifespan of a double deletion strain (S5A Fig.). Potential redundancy could also occur with a third related transcriptional repressor, Mig3, that is regulated by Snf1 [48], although the genes regulated by Mig3 do not overlap with genes regulated by Mig1 and Mig2 [48]. We found that mig3Δ cells exhibit a short lifespan and this phenotype was not affected by loss of Mig1, Mig2 or both (S5B, C Fig.). Although these data did not provide evidence that Mig1 or Mig2 have a substantial impact on longevity, we found that Mig1 is required for proteasome-mediated lifespan extension and is epistatic to compromised proteasome function found in cells lacking RPN4 (Fig. 4C). Similar results were obtained with strains in the absence of Mig2 (Fig. 4D).
Increased proteasome capacity results in enhanced turnover of the transcriptional repressor Mig1
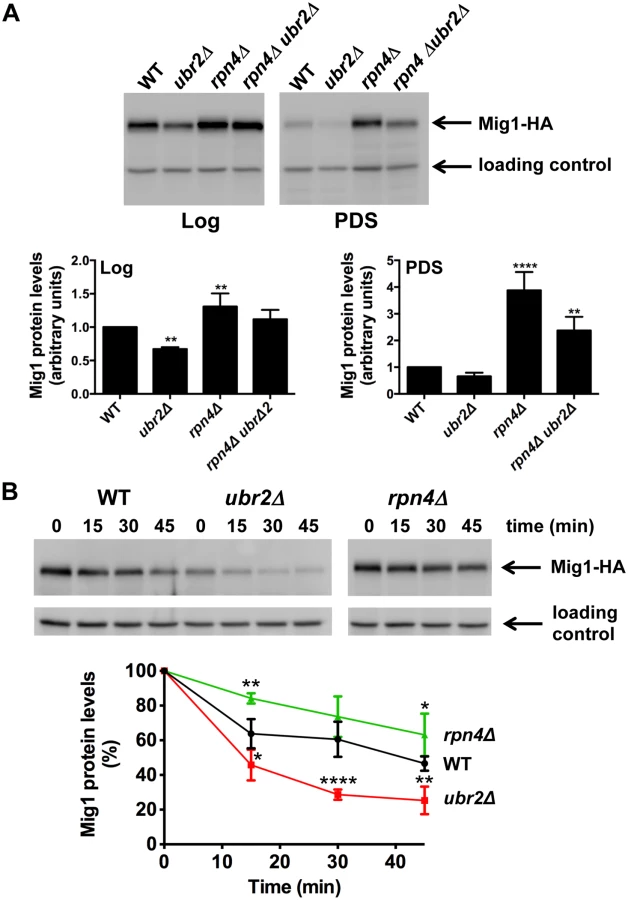
To gain mechanistic information on the functional interaction between the proteasome and AMPK/Snf1 signaling, we aimed to identify potential proteolytic targets within this signaling pathway. We analyzed the abundance of Snf1, Mig1, Mig2 and Hxk2, an important regulator of Mig1 and Snf1 [22, 51] in cells with increased or reduced proteasome abundance. We found that Snf1 abundance was unaltered in ubr2Δ or rpn4Δ cells both under fermentative (log) or oxidative growth conditions (PDS) (S6A Fig.). Hxk2 levels were also not affected by varying proteasome levels during logarithmic growth but were elevated after the shift to oxidative metabolism (PDS) in rpn4Δ cells (S6B Fig.). ubr2Δ cells on the other hand do not exhibit reduced Hxk2 levels. Thus, the increase observed in cells devoid of RPN4 might not be a consequence of reduced proteasomal turnover. Mig1, however, was present at reduced levels in cells with increased proteasome activity (ubr2Δ) and at increased levels in cells with reduced proteasome activity (rpn4Δ) under both metabolic conditions (Fig. 5A). These data suggest that Mig1 is degraded by the proteasome. To unequivocally demonstrate that Mig1 is degraded by the proteasome we tested the degradation of Mig1 in cells with increased and decreased proteasome capacity using a cycloheximide (CHX) chase assay. We observed Mig1 turnover in WT cells (Fig. 5B). The rate of degradation was reduced in rpn4Δ cells and elevated in the ubr2Δ cells (Fig. 5B). Additionally, the proteasome-specific inhibitor MG132 reduced the turnover in WT and ubr2Δ cells (S7 Fig.). Thus, Mig1 abundance is regulated by the proteasome.
Our findings suggest that altered Mig1 levels in cells with increased or decreased proteasome activity might contribute to proteasome-mediated effects on lifespan. This hypothesis predicts that an artificial rise in Mig1 levels might compromise the lifespan extension observed in cells with increased proteasome activity. To test this we investigated lifespans in proteasome mutants where the endogenous Mig1 promoter has been exchanged against the constitutively overexpressing promoter of TEF1. In agreement with a previous study [52], overexpression of the gene resulted in a reduction in lifespan (Fig. 6A, TEFpMIG1) supporting the hypothesis that Mig1 is a negative regulator of lifespan. Interestingly, lifespan extension in cells with increased proteasome activity is abrogated upon MIG1 overexpression. Thus, directed turnover of Mig1 (Fig. 5) is likely important for enhanced longevity through enhanced proteasome function.

Increased proteasome activity correlates with incorrect Mig1 localization
The data presented in Fig. 6A demonstrate that Mig1 overexpression results in a shortened RLS. Consequently, the reduced turnover of Mig1 in cells with reduced proteasome activity might contribute to lifespan shortening in rpn4Δ cells (Fig. 4C, right panel). Surprisingly, however, the residual Mig1 in ubr2Δ cells is required for proteasome-mediated lifespan extension as complete loss of Mig1 abrogates lifespan extension (Fig. 4C, right panel). Two potential scenarios might explain these findings: 1) Loss of MIG1 could result in a compensatory upregulation of a negative regulator of lifespan. As a potential candidate we investigated the level of Hxk2, but found no evidence for increased abundance (S6C Fig.). 2) Alternatively, in addition to its function as a transcriptional repressor, Mig1 could have a second function that positively contributes to longevity.
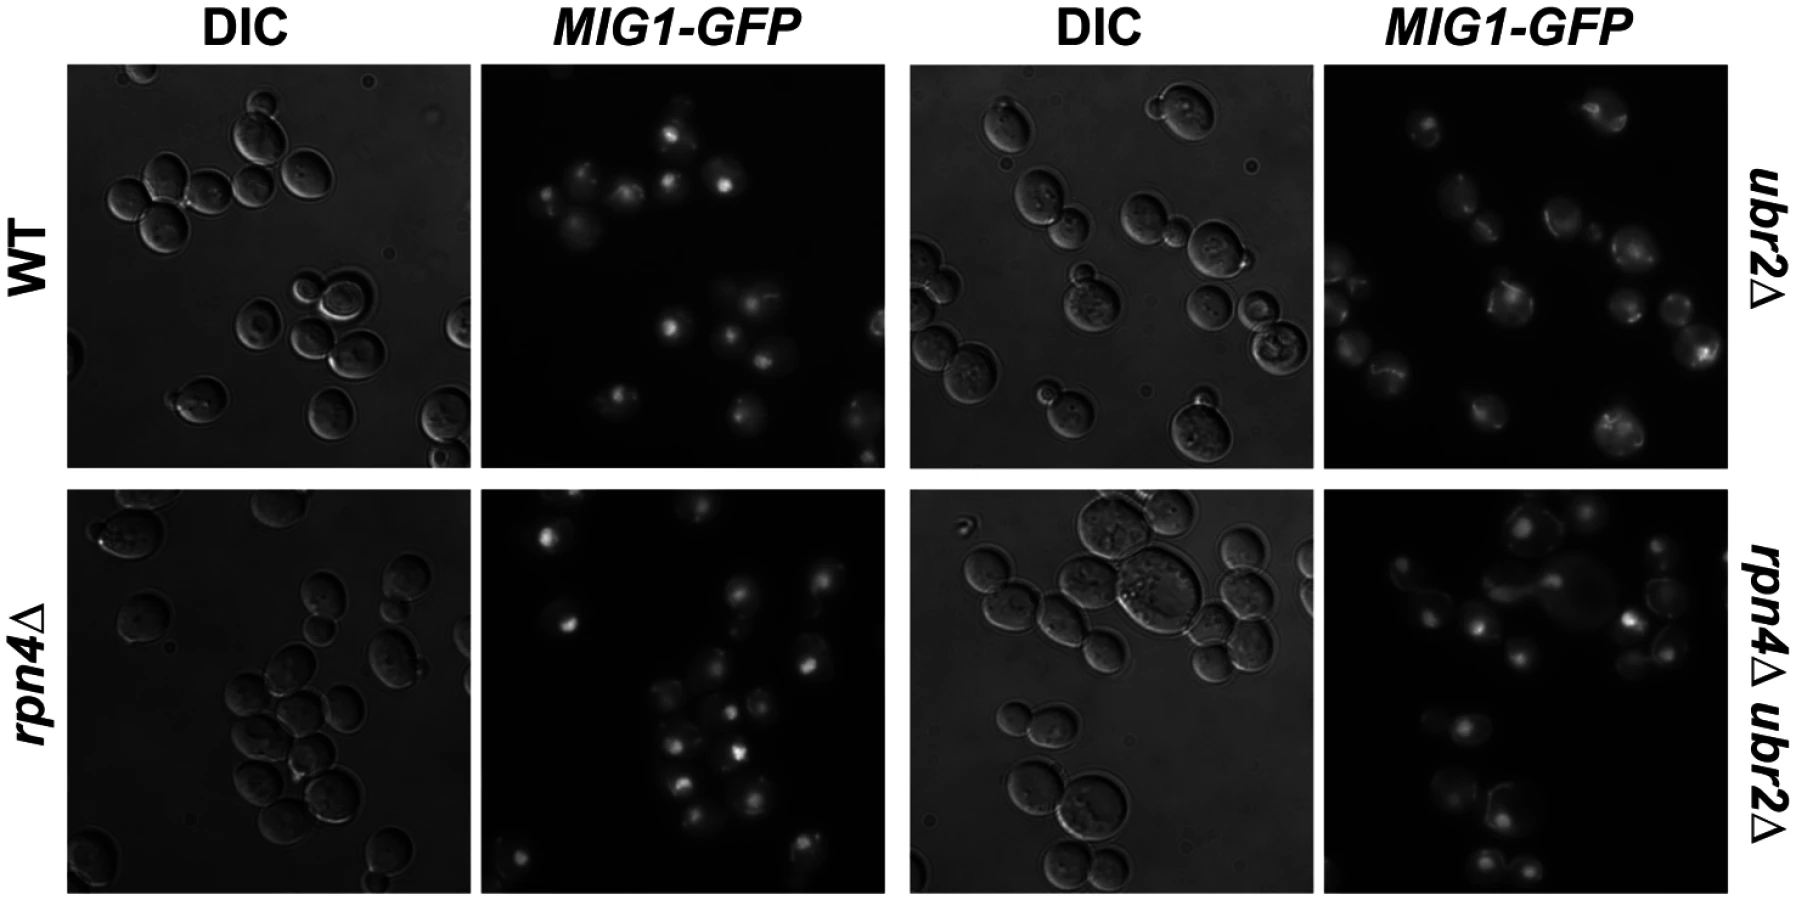
Under derepressed conditions, Snf1-mediated phosphorylation of Mig1 triggers its nuclear export and results in derepression of its target genes [51]. Mig1 export from the nucleus into the cytoplasm has also been reported in aged mother cells [21], suggesting that the nuclear export of Mig1 might be relevant for replicative lifespan. We therefore constructed a genomically integrated Mig1 point mutant (mig1S311A) that has been previously demonstrated to prevent Mig1 phosphorylation and nuclear export in response to Snf1 activation [51]. Interestingly, this mutant is short-lived and strongly reduces lifespan extension in cells with increased proteasome activity (Fig. 6B) demonstrating that Mig1 export is a crucial mechanism that affects longevity in cells with increased proteasome activity. We therefore considered the possibility that cytoplasmic Mig1 assumes a function that is distinct from its nuclear role as a transcriptional repressor during respiratory growth and analyzed its localization in proteasome mutants. While all WT cells displayed a predominantly nuclear localization of Mig1, ~50% of ubr2Δ cells exhibited a cytoplasmic distribution of Mig1 (Figs. 7 and 8). Additionally, we observed that Mig1 was recruited to the mitochondria in cells with increased proteasome capacity (Figs. 7 and 8, merged panels). Since a recent report demonstrated that Mig2 re-localizes to the mitochondria after Snf1 activation and the induction of respiration [53], our data suggest that both homologs can be re-routed to the mitochondria.

Disruption of MIG2 results in a hyperfragmented mitochondrial network [53]. We therefore anticipated that if the recruitment of Mig1 to the mitochondria has functional consequences similar to mitochondrial recruitment of Mig2 after the diauxic shift, we might observe changes in mitochondrial morphology. Similar to loss of MIG2, deletion of MIG1 causes hyperfragmentation of the mitochondrial network (S8 Fig.). This could indicate that Mig1 impacts mitochondrial morphology or respiratory capacity.
The proteasome, Sir2 and Hxk2 form an interconnected aging network
To further explore the impact of Mig1 on yeast longevity, we measured the lifespan of cells deleted for MIG1 in two additional strains that confer robust lifespan extension in yeast: SIR2-OE and hxk2Δ. Hxk2 is a protein with two functions: it catalyzes the first step in glycolysis, but also is involved in regulating AMPK/Snf1 signaling [54]. Deletion of the gene results in increased respiration, a transcriptional profile similar to cells under caloric restriction and robustly extends replicative and chronological lifespan in yeast [2, 22, 55]. Hxk2 also directly regulates Mig1 and loss of Hxk2 results in Mig1 inactivation [51]. As a consequence, Mig1 fails to be imported into the nucleus in the absence of HXK2 (Fig. 8B) [51]. Since HXK2 is an upstream activator of MIG1 we expected that loss of MIG1 should not affect the long lifespan of cells in the absence of HXK2, which we confirmed (Fig. 8A).
Overexpression of SIR2 confers increased longevity [56]. While there is no information available in yeast, the mammalian ortholog of Sir2, SIRT1 has been linked previously to AMPK function. SIRT1 regulates the activity of LKB1 kinase, an activator of mammalian AMPK [57]. On the other hand, AMPK activation results in increased NAD+ levels, which in turn activates the activity of SIRT1 [58]. Thus, SIRT1 and AMPK are functionally linked through a positive feedback loop in mammalian cells [59]. We therefore speculated that loss of the AMPK/Snf1 target MIG1 might impact SIR2-OE longevity in yeast. Interestingly, deletion of MIG1 in a strain overexpressing SIR2 results in a growth defect in the presence of glucose or non-fermentable carbon sources (S6 Fig.). The cells also are exquisitely sensitive to oxidative stress induced by the addition of cadmium chloride to the medium (S6 Fig.). Additionally, we observed that loss of MIG1 abrogates Sir2-mediated RLS extension (Fig. 9B, left panel). These results are similar to the loss of lifespan extension mediated by proteasome overexpression in the absence of MIG1 (Fig. 4C, left panel). Furthermore, deletion of the Snf1 β-subunit Sip2 reduces SIR2-OE-mediated lifespan extension (Fig. 9B, left panel). To test whether Sir2 has an impact on Mig1, we investigated the localization of Mig1 in cells that overexpress SIR2. Similar to cells lacking HXK2 and partially in ubr2Δ cells, Mig1 import into the nucleus under repressive conditions is impaired (Fig. 8). These observations indicate an interaction between AMPK/Snf1 signaling and Sir2-mediated effects on lifespan and suggest that Sir2 negatively regulates Mig1.

Having established that AMPK/Snf1 signaling affects SIR2-OE-mediated lifespan extension and that increased proteasome activity results in deregulation of the kinase signaling pathway, we hypothesized that potentially varying proteasome levels could also affect the impact of Sir2 or Hxk2 on lifespan. We therefore determined whether changes in proteasome activity alter SIR2-OE and hxk2Δ-mediated lifespan extension. In both strains, increased proteasome activity led to a slightly additive affect (Fig. 9 C, D, left panels). Interestingly, reduced proteasome activity completely blocked lifespan extension for both strains (Fig. 9 C, D, right panels) potentially a consequence of the increased Mig1 levels in rpn4Δ cells (Fig. 4C) as MIG1 overexpression shortens lifespan [52]. These findings point to an intricate link between AMPK/Snf1 signaling, Hxk2, Sir2 and the proteasome that impacts lifespan at least partially through modulation of Mig1 activity as depicted in the model presented in Fig. 10.

Discussion
The activity of the proteasome is required for cellular fitness at many levels. It is a crucial component of the cellular network that maintains protein homeostasis and proteasome-mediated degradation is required for the regulation of a multitude of pathways through the targeted and irreversible elimination of individual components. Many studies demonstrate that proteasomal activity declines in aging cells [30, 60] and we and others have shown that elevated proteasome capacity has a beneficial effect on lifespan [24, 25, 26, 30]. We reported that increased proteasome capacity ameliorates proteotoxic stress [24] and a recent study demonstrated that elevated proteasome activity reduces the aggregation of endogenous misfolding proteins in aged mother cell [30]. These findings raise the possibility that the beneficial effect of enhanced proteasomal degradation in aging cells might largely be attributed to improved protein homeostasis. Here we show that increased proteasome activity also results in altered metabolic signaling, mediated by deregulation of the AMPK/Snf1 pathway and that this activity is required for the positive impact of enhanced proteasome function in aging cells. We demonstrate that proteasomes participate in the regulation of AMPK/Snf1 signaling through degradation of the transcriptional repressor Mig1. Cells with increased proteasome activity exhibit reduced Mig1 levels, increased expression of genes required for the induction of respiratory metabolism, enhanced oxidative stress response and elevated respiratory capacity. The data support a model in which the pro-longevity effect of increased proteasome function in aging cells partially originates from a premature induction of respiration resulting in a mitohormetic response.
Previous reports support a complex functional link between the proteasome and mitochondria. Compromised mitochondrial activity results in decreased proteasomal degradation [61, 62] and dissociation of the proteasome holocomplex [63, 64] most likely caused by oxidative modification of proteasome subunits. Conversely, treating cells or model organisms with proteasome inhibitors impairs mitochondrial activity resulting in increased ROS levels and enhanced mitophagy [65, 66]. Additionally, a reduction in proteasome assembly in response to deletion of the assembly factor UMP1 causes enhanced instability of mitochondrial DNA [67]. The results presented here provide additional information on the mutual interaction between mitochondria and proteasomes, by demonstrating that proteasomal activity is required for correct execution of AMPK/Snf1 signaling and thus for regulation of mitochondria biogenesis.
The AMPK/Snf1 signaling pathway is highly conserved, representing a key sensor of the cellular energy level that regulates metabolic adaptation and mitochondrial biogenesis. Although many studies implicate the AMPK/Snf1 pathway in modulating the aging process, its precise role in aging cells is unclear [44]. AMPK/Snf1 is activated in aging cells [68] or after the administration of CR mimetic drugs such as rapamycin or resveratrol [44]. However, overexpression of yeast SNF1 shortens lifespan [21, 22] and overexpression of the AMPK activator LKB1 can induce senescence in certain eukaryotic systems [69]. Thus, the activity of Snf1 needs to be tightly regulated. Our data reveal a novel mechanism that contributes to the fidelity of AMPK/Snf1 signaling: proteasomal degradation of AMPK/Snf1-regulated transcription factors.
Mig1, Mig2 and Hxk2 are crucial downstream components of the AMPK/Snf1 signaling pathway in yeast. Several studies link these factors to longevity regulation for both replicative and chronological aging paradigms in yeast. A network biology approach predicted and confirmed that Snf1, Hxk2 and Mig1 are modulators of chronological lifespan in yeast [22] and these genes also contribute to replicative aging [52]. These findings are in agreement with a recent study that demonstrated that mitochondrial function is crucial for both yeast aging paradigms [70]. While both deletion and overexpression of SNF1 shortens lifespan [22], deletion of HXK2 results in a robust lifespan extension [2, 71]. Transcriptional and metabolomic analyses indicate that cells devoid of HXK2 likely exhibit a CR profile [2, 50] and Hxk2 was found to be a key integrator of glucose sensing and metabolic adaptation in aging cells [22]. Hxk2 has also an enzymatic function in glycolysis as it phosphorylates glucose [72] and impaired initiation of glycolysis in cells devoid of HKX2 might contribute to hxk2Δ-mediated lifespan extension. MIG1 overexpression accelerates replicative and chronological aging and loss of MIG2 enhances RLS [52]. Our data indicate that Mig1 and Mig2 have a redundant function in regulating lifespan. While deletion of either gene had a marginal impact of lifespan, co-deletion conferred robust extension. In summary, the three AMPK/Snf1 regulated transcriptional repressors, Hxk2, Mig1, and Mig2 are negative regulators of lifespan.
Our data furthermore demonstrate that Mig1 is (1) a proteasome target, (2) required for proteasome-mediated lifespan extension and (3) is incorrectly processed under repressive conditions in cells with increased proteasome abundance. Moreover, increased proteasome activity leads to incorrect localization of the transcriptional repressor under repressive conditions. These findings correlate with increased respiration, elevated oxidative stress response and increased expression of AMPK/Snf1 target genes. Thus, our data are consistent with a model in which increased proteasomal degradation of Mig1 leads to a partial inactivation of Mig1 and in consequence to a premature activation of the AMPK/Snf1 pathway. A link between Mig1 and the ubiquitin/proteasome system is further supported by a recent report demonstrating that MIG1 deletion rescues the lifespan defect of a mutant anaphase-promoting complex (APC), an E3 ubiquitin ligase complex that is required for optimal lifespan [52].
Surprisingly, however, deletion of MIG1 abrogated the lifespan extension in cells with increased proteasome activity, indicating that Mig1 is required for proteasome-mediated lifespan extension. We also observed that Mig1 exhibited reduced nuclear localization and relocalized to the mitochondria in cells with increased proteasome activity under repressive conditions and a mutant (mig1S311A) that prevents nuclear export of Mig1 abrogates proteasome-mediated lifespan extension. Two potential scenarios could explain the impaired lifespan extension in the absence of MIG1: a) loss of MIG1 induces increased expression of a second negative regulator of lifespan that overrides the pro-longevity effect of increased proteasome activity or b) the protein has a dual role as both a negative and positive regulator of lifespan. Under repressive conditions Mig1 functions as a transcriptional repressor to prevent premature activation of respiration [22, 50]. Under starvation conditions, however, the protein relocalizes to the mitochondria and promotes mitochondrial function by an unknown mechanism. Interestingly, a previous study showed that the Mig1 partner, Mig2 also exits the nucleus and is recruited to the mitochondria upon Snf1 activation by glucose depletion [53]. Although the functional consequences of Mig2 recruitment to the mitochondria are not fully understood, the mitochondria fragment in the absence of MIG2 upon glucose depletion and deletion of Mig2 also rescues the hyperfused mitochondria phenotype of cells deleted for the mitochondrial fission protein Dnm1 [53]. Thus, Mig2 appears to antagonize mitochondrial fission during respiratory growth. Mig1 has not been investigated in that context. Our analysis shows, however, that like Mig2, Mig1 also impacts mitochondrial dynamics as mig1Δ cells exhibit a high percentage of fragmented mitochondria. Whether the incorrect mitochondrial morphology is a primary consequence of Mig1 preventing mitochondrial fission or whether it is a secondary effect in response to altered mitochondrial function is currently not known. A dual mitochondria-related function of Mig1/2, however, would point to a scenario where these proteins are involved in nuclear-mitochondrial communication [73].
The data presented also indicate a mutual link between AMPK signaling and lifespan extension mediated by elevated SIR2 expression as both MIG1 deletion as well as deletion of the Snf1 β-subunit SIP2 abrogated the beneficial impact of SIR2 overexpression on longevity. Sir2 is a protein-deacetylase with histones as primary targets and its positive impact on yeast lifespan was largely attributed to a reduction in the formation of extrachromosomal rRNA circles (ERCs) that impede lifespan [56]. Our data, however, link SIR2-mediated lifespan extension in yeast to AMPK/Snf1 signaling and are consistent with findings in mammalian cells demonstrating that altered NAD/NADH levels in cells with compromised AMPK signaling modulate Sir2 since NAD is a substrate [74]. Our findings also indicate that Sir2 activity might impact metabolic regulation, as Mig1 localization was affected in cells overexpressing SIR2. Similar to cells with increased proteasome function, the nuclear localization of Mig1 was abrogated in this strain, suggesting that Sir2 is involved in negative regulation of Mig1, potentially through deacetylation of non-histone proteins within the AMPK/Snf1 signaling pathway.
In this study, we have identified proteasomes and Sir2 as negative regulators of Mig1. In both cases enhanced activity has a pro-longevity effect. In line with these findings is the observation that deletion of a positive regulator of Mig1, HXK2, also induces robust lifespan extension. Additionally, we observed that MIG1 deletion abrogates both proteasome and Sir2-mediated lifespan extension, while this genetic intervention had no effect on lifespan extension in the absence of HXK2, consistent with Hxk2 being an upstream activator of Mig1. We furthermore observed that reduced proteasome activity abrogates lifespan extension in cells with increased Sir2 levels or deleted for HXK2. The congruent genetic and functional interactions are indicative of synergy between AMPK/Snf1 signaling, proteasome-mediated degradation and Sir2-dependent deacetylation in aging cells and argue for a model in which these pathways form an interconnected network that impinges on Mig1 to regulate respiration and lifespan (Fig. 10).
Materials and Methods
Strains and media
All strains are isogenic to BY4741 or BY4742 and are S288C derivatives [75]. The genotypes are listed in S1 Table. Complete gene deletion, promoter exchange or tag integration was performed at the genomic locus by homologous recombination using standard genetic techniques. Unless otherwise noted strains were grown in YPD medium (1% yeast extract, 2% bactopeptone, 2% glucose). Experiments with alternate carbon sources were done with 2% galactose, 2% raffinose or 3% glycerol replacing glucose. For logarithmic cultures cells were grown to O.D. < 0.5 and post-diauxic shift cultures were harvested after overnight incubation. mig1S311A strains were constructed using the 50 : 50 method for marker-free, seamless genome editing as described previously [76]. Briefly, the URA3 cassette from vector pRS416 was amplified via polymerase chain reaction (PCR) using two specific primers, a 50 : 50 primer and a standard reverse primer. The 50 : 50 primers were designed as follows: (5′ to 3′) 50 nucleotides (nt) directly upstream of MIG1S311 and 50 nt directly downstream of MIG1S311 and a sequence for priming the URA3 locus.
YY220:GAAGTCTCAGAGCACAAACTCAGAGTTCCGTACAGTTGAAGAGACCAAGTGCAGTTTTAAGTTTGAACGACTTGTTGGTTGGCCAAAGAAATACCAACGAATCggcttaactatgcggcatcag
The reverse primer contained 50 nt directly downstream of MIG1S311 and a sequence for priming URA3 YY221:GATTCGTTGGTATTTCTTTGGCCAACCAACAAGTCGTTCAAACTTAAAACcgtttacaatttcctgatgcgg.
A standard homologous recombination transformation method with this PCR cassette was performed in BY4742, yMS1773 and yMS1776 strains. Correct transformants were selected on medium in the absence of uracil, identified by genomic PCR using primers specific to both sides of the integrated URA3 cassette and transferred on 5-fluoro-orotic acid (5-FOA) medium to remove URA3 cassette. The correct mutation was finally confirmed by DNA sequencing.
Replicative lifespan analysis
Replicative lifespan assays were carried out as described previously [24]. Unless otherwise noted, all lifespan experiments were performed on YPD plates with 2% glucose. Lifespan curves in Figs. 1A, C, D, and 7D were compiled from multiple assays containing experimentally matched WT and single mutant controls.
Analysis of respiratory capacity
The oxygen consumption of WT, ubr2Δ, rpn4Δ, and ubr2Δ rpn4Δ cells was measured at 30°C using an Oroboros instrument (Oroboros, Graz, Austria). Respiratory rates JO were determined from the slope of a plot of O2 concentration versus time. For all assays 2 ml of a growing cell suspension were used. Respiration assays of growing cells were performed in YEP + 2% galactose or 2% lactate when applicable triethyltin bromide, TET (Sigma) was added at 0.2 mM and carbonyl cyanide m-chlorophenyl hydrazone, CCCP (Sigma) at 10 μM. RSV, respiratory state value is defined as (JO2basal–JO2TET)/ (JO2CCCP–JO2TET). RSV represents the percentage of stimulation of oxidative phosphorylation compared to the basal respiration capacity [41].
Live cell fluorescence microscopy
Mitochondria-targeted plasmids Cox4-GFP (pOK29) [77] or plasmid mito-dsRed [78] were introduced into the strains indicated via transformation. The cells were grown in SD medium including 2% glucose and imaged at the early logarithmic growth of O.D.660nm 0.4–0.5. The localization of Msn2 and Mig1 during logarithmic growth in SD medium including 4% glucose was investigated via a genomic integration of GFP at the C-terminus of both proteins followed by live cell fluorescence imaging. Live cell fluorescence was monitored using a fluorescence microscope (Olympus BX61) at the Albert Einstein Imaging Facility with a 100X NA 1.4 objective (PlanApo). Fluorescence or differential interference contrast (DIC) images were captured with a cooled CCD camera (Sensicam QE) using IPlab 4.0 software. Images were identically processed using ImageJ software 1.42q. For excitation of mtGFP, a 470–495 nm band pass filter was used and a 530–582 nm filter was used for mtRed. Emitted light was detected with a 510–550 nm long pass filter for mtGFP and a 600–665 nm filter for mtRed (filter set Olympus). For visualizing mitochondria 20 Z-section images were captured with a 0.2 γm distance between two neighboring sections. Projected sequential Z-stack images were created in ImageJ 1.42q. Overlays between Mig1 and mitochondrial signals were created in Adobe Photoshop CS5.1.
Quantitative Real-Time PCR analysis
Strains were grown to mid-log phase (O.D.600nm = 0.5) in 2% glucose medium, then switched in 2% galactose medium and inoculated for 4 hours. Total RNA was prepared using a standard phenol-chloroform extraction method. 1 μg RNA was treated with DNase I (Life Technilogies), followed by reverse transcription using the High Capacity cDNA kit (Applied Biosystems). cDNA from 1 μg RNA was subjected to qRT-PCR using the LightCycler 480 SYBR Green I Master (Roche) in the LightCycler 480 Instrument (Roche). The reactions were performed in 45 cycles with 95°C for 10 sec, 55°C for 20 sec and 72°C for 30 sec after an initial activation at 95°C for 5 min. Negative controls were run simultaneously for each reaction. Data were analyzed using the LightCycler 480 software. To compare the relative mRNA expression between the individual genes and the reference gene ACT1, the comparative threshold cycle (CT) method was used. The amount of target, relative to the reference gene as described in the Fig. legends, is given by 2-ΔΔCT. All reactions were performed in triplicates. Error bars indicate the standard error of the mean (± SEM) of three independent experiments. One-way ANOVA tests were performed between strain transcript level averages to assess significance using the GraphPad Prism 6 software. Primers are listed in S2 Table.
Gel electrophoresis and immunoblotting
Cells from WT and mutant strains were harvested in the respective growth phases at O.D.660nm:1 for logarithmic cultures and at O.D.660nm:>8 for post-diauxic cultures. Cells were disrupted by alkaline lysis as described previously [79] with modifications. TE buffer (10mM Tris pH7.5, 1mM EDTA) was used instead of water. Protein concentration was determined by a Bradford protein assay (BioRad). Equal amounts of proteins were loaded on 12% SDS-polyacrylamide gels and subjected to electrophoresis. The gels were blotted onto PVDF membranes. The membranes were probed with anti-HA 12C5 (Roche) antibodies to detect Hxk2, Mig1 and Fzo1. Anti-Flag (Stratagene) was used to visualize Snf1. Anti-phosphoglycerate kinase (Pgk1) antibodies (Invitrogen) were used as a loading control. Protein bands were detected via enhanced chemiluminescence using an ImageQuant LAS4000 mini system (GE Healthcare). The protein intensity was quantified using the ImageQuant TL software (GE Healthcare).
Cycloheximide chase assay
Overnight cultures of WT, ubr2Δ, and rpn4Δ cells expressing MIG1–3HA were diluted to O.D660nm: 0.5 and incubated for 2h in YPD. Cells were washed, transferred into YPGal and grown for 4h prior to the addition of 200 μg/ml CHX. For proteasome inhibition, PDR5, a gene that encodes a drug efflux pump [80], was deleted in WT, ubr2Δ, or rpn4Δ strains. Cells were grown in YPGal for 1.5h before 100 μM MG132 (CalBiochem) or DMSO were added and incubated for another 1.5h in the presence of the inhibitor prior to the addition of 200 μg/ml CHX. At the time indicated aliquots were harvested and frozen in liquid nitrogen. After alkaline lysis [59] and measuring the total protein concentration with a Bradford reagent (Pierce), 20 μg were subjected to SDS-PAGE and immuno-detection using an anti-HA polyclonal antibody (Roche). anti-Pgk1 antibodies (Invitrogen) were used as a loading control. Signals were visualized using ECL chemiluminescence in an ImageQuant LAS 4000 imager (GE Healthcare) and quantified using the ImageQuant software package. Statistical analysis was performed with GraphPad Prism 6 using two-way ANOVA with grouped analysis and is based on three independent experiments.
Supporting Information
Zdroje
1. Schulz TJ, Zarse K, Voigt A, Urban N, Birringer M, et al. (2007) Glucose restriction extends Caenorhabditis elegans life span by inducing mitochondrial respiration and increasing oxidative stress. Cell Metab 6 : 280–293. doi: 10.1016/j.cmet.2007.08.011 17908557
2. Lin SJ, Kaeberlein M, Andalis AA, Sturtz LA, Defossez PA, et al. (2002) Calorie restriction extends Saccharomyces cerevisiae lifespan by increasing respiration. Nature 418 : 344–348. doi: 10.1038/nature00829 12124627
3. Lopez-Lluch G, Hunt N, Jones B, Zhu M, Jamieson H, et al. (2006) Calorie restriction induces mitochondrial biogenesis and bioenergetic efficiency. Proc Natl Acad Sci U S A 103 : 1768–1773. doi: 10.1073/pnas.0510452103 16446459
4. Yang W, Hekimi S (2010) A mitochondrial superoxide signal triggers increased longevity in Caenorhabditis elegans. PLoS Biol 8: e1000556. doi: 10.1371/journal.pbio.1000556 21151885
5. Andziak B, O’Connor TP, Qi W, DeWaal EM, Pierce A, et al. (2006) High oxidative damage levels in the longest-living rodent, the naked mole-rat. Aging cell 5 : 463–471. doi: 10.1111/j.1474-9726.2006.00237.x 17054663
6. Pan Y, Schroeder EA, Ocampo A, Barrientos A, Shadel GS (2011) Regulation of yeast chronological life span by TORC1 via adaptive mitochondrial ROS signaling. Cell Metab 13 : 668–678. doi: 10.1016/j.cmet.2011.03.018 21641548
7. Ocampo A, Liu J, Schroeder EA, Shadel GS, Barrientos A (2012) Mitochondrial respiratory thresholds regulate yeast chronological life span and its extension by caloric restriction. Cell Metab 16 : 55–67. doi: 10.1016/j.cmet.2012.05.013 22768839
8. Markaki M, Tavernarakis N (2013) Metabolic control by target of rapamycin and autophagy during ageing—a mini-review. Gerontology 59 : 340–348. doi: 10.1159/000348599 23594965
9. Kaeberlein M (2010) Resveratrol and rapamycin: are they anti-aging drugs? Bioessays 32 : 96–99. doi: 10.1002/bies.200900171 20091754
10. Hughes KJ, Kennedy BK (2012) Cell biology. Rapamycin paradox resolved. Science 335 : 1578–1579. doi: 10.1126/science.1221365 22461595
11. Kennedy BK, Pennypacker JK (2014) Drugs that modulate aging: the promising yet difficult path ahead. Translational research: the journal of laboratory and clinical medicine 163 : 456–465. doi: 10.1016/j.trsl.2013.11.007
12. Inoki K, Kim J, Guan KL (2012) AMPK and mTOR in cellular energy homeostasis and drug targets. Annual review of pharmacology and toxicology 52 : 381–400. doi: 10.1146/annurev-pharmtox-010611-134537 22017684
13. Jager S, Handschin C, St-Pierre J, Spiegelman BM (2007) AMP-activated protein kinase (AMPK) action in skeletal muscle via direct phosphorylation of PGC-1alpha. Proc Natl Acad Sci U S A 104 : 12017–12022. doi: 10.1073/pnas.0705070104 17609368
14. Fendt SM, Sauer U (2010) Transcriptional regulation of respiration in yeast metabolizing differently repressive carbon substrates. BMC Syst Biol 4 : 12. doi: 10.1186/1752-0509-4-12 20167065
15. Egan D, Kim J, Shaw RJ, Guan KL (2011) The autophagy initiating kinase ULK1 is regulated via opposing phosphorylation by AMPK and mTOR. Autophagy 7 : 643–644. doi: 10.4161/auto.7.6.15123 21460621
16. Usaite R, Jewett MC, Oliveira AP, Yates JR 3rd, Olsson L, et al. (2009) Reconstruction of the yeast Snf1 kinase regulatory network reveals its role as a global energy regulator. Molecular systems biology 5 : 319. doi: 10.1038/msb.2009.67 19888214
17. Canto C, Auwerx J (2011) Calorie restriction: is AMPK a key sensor and effector? Physiology 26 : 214–224. doi: 10.1152/physiol.00010.2011 21841070
18. Martin-Montalvo A, Mercken EM, Mitchell SJ, Palacios HH, Mote PL, et al. (2013) Metformin improves healthspan and lifespan in mice. Nature communications 4 : 2192. doi: 10.1038/ncomms3192 23900241
19. Apfeld J, O’Connor G, McDonagh T, DiStefano PS, Curtis R (2004) The AMP-activated protein kinase AAK-2 links energy levels and insulin-like signals to lifespan in C. elegans. Genes & development 18 : 3004–3009. doi: 10.1101/gad.1255404
20. Tohyama D, Yamaguchi A (2010) A critical role of SNF1A/dAMPKalpha (Drosophila AMP-activated protein kinase alpha) in muscle on longevity and stress resistance in Drosophila melanogaster. Biochem Biophys Res Commun 394 : 112–118. doi: 10.1016/j.bbrc.2010.02.126 20184862
21. Ashrafi K, Lin SS, Manchester JK, Gordon JI (2000) Sip2p and its partner snf1p kinase affect aging in S. cerevisiae. Genes & development 14 : 1872–1885.
22. Lorenz DR, Cantor CR, Collins JJ (2009) A network biology approach to aging in yeast. Proc Natl Acad Sci U S A 106 : 1145–1150. doi: 10.1073/pnas.0812551106 19164565
23. Finley D (2009) Recognition and processing of ubiquitin-protein conjugates by the proteasome. Annual review of biochemistry 78 : 477–513. doi: 10.1146/annurev.biochem.78.081507.101607 19489727
24. Kruegel U, Robison B, Dange T, Kahlert G, Delaney JR, et al. (2011) Elevated proteasome capacity extends replicative lifespan in Saccharomyces cerevisiae. PLoS genetics 7: e1002253. doi: 10.1371/journal.pgen.1002253 21931558
25. Vilchez D, Morantte I, Liu Z, Douglas PM, Merkwirth C, et al. (2012) RPN-6 determines C. elegans longevity under proteotoxic stress conditions. Nature 489 : 263–268. doi: 10.1038/nature11315 22922647
26. Tonoki A, Kuranaga E, Tomioka T, Hamazaki J, Murata S, et al. (2009) Genetic evidence linking age-dependent attenuation of the 26S proteasome with the aging process. Mol Cell Biol 29 : 1095–1106. doi: 10.1128/MCB.01227-08 19075009
27. Chondrogianni N, Petropoulos I, Franceschi C, Friguet B, Gonos ES (2000) Fibroblast cultures from healthy centenarians have an active proteasome. Experimental gerontology 35 : 721–728. doi: 10.1016/S0531-5565(00)00137-6 11053662
28. Perez VI, Buffenstein R, Masamsetti V, Leonard S, Salmon AB, et al. (2009) Protein stability and resistance to oxidative stress are determinants of longevity in the longest-living rodent, the naked mole-rat. Proc Natl Acad Sci U S A 106 : 3059–3064. doi: 10.1073/pnas.0809620106 19223593
29. Salmon AB, Leonard S, Masamsetti V, Pierce A, Podlutsky AJ, et al. (2009) The long lifespan of two bat species is correlated with resistance to protein oxidation and enhanced protein homeostasis. FASEB J 23 : 2317–2326. doi: 10.1096/fj.08-122523 19244163
30. Andersson V, Hanzen S, Liu B, Molin M, Nystrom T (2013) Enhancing protein disaggregation restores proteasome activity in aged cells. Aging 5 : 802–812. 24243762
31. Geng F, Wenzel S, Tansey WP (2012) Ubiquitin and proteasomes in transcription. Annu Rev Biochem 81 : 177–201. doi: 10.1146/annurev-biochem-052110-120012 22404630
32. Xie Y, Varshavsky A (2001) RPN4 is a ligand, substrate, and transcriptional regulator of the 26S proteasome: a negative feedback circuit. Proc Natl Acad Sci U S A 98 : 3056–3061. doi: 10.1073/pnas.071022298 11248031
33. Taylor EB, Rutter J (2011) Mitochondrial quality control by the ubiquitin-proteasome system. Biochem Soc Trans 39 : 1509–1513. doi: 10.1042/BST0391509 21936843
34. Cohen MM, Leboucher GP, Livnat-Levanon N, Glickman MH, Weissman AM (2008) Ubiquitin-proteasome-dependent degradation of a mitofusin, a critical regulator of mitochondrial fusion. Molecular biology of the cell 19 : 2457–2464. doi: 10.1091/mbc.E08-02-0227 18353967
35. Escobar-Henriques M, Westermann B, Langer T (2006) Regulation of mitochondrial fusion by the F-box protein Mdm30 involves proteasome-independent turnover of Fzo1. The Journal of cell biology 173 : 645–650. doi: 10.1083/jcb.200512079 16735578
36. Leboucher GP, Tsai YC, Yang M, Shaw KC, Zhou M, et al. (2012) Stress-induced phosphorylation and proteasomal degradation of mitofusin 2 facilitates mitochondrial fragmentation and apoptosis. Mol Cell 47 : 547–557. doi: 10.1016/j.molcel.2012.05.041 22748923
37. Tar K, Dange T, Yang C, Yao Y, Bulteau AL, et al. (2014) Proteasomes Associated with the Blm10 Activator Protein Antagonize Mitochondrial Fission through Degradation of the Fission Protein Dnm1. J Biol Chem 289 : 12145–12156. doi: 10.1074/jbc.M114.554105 24604417
38. Hermann GJ, Thatcher JW, Mills JP, Hales KG, Fuller MT, et al. (1998) Mitochondrial fusion in yeast requires the transmembrane GTPase Fzo1p. J Cell Biol 143 : 359–373. doi: 10.1083/jcb.143.2.359 9786948
39. Westermann B (2012) Bioenergetic role of mitochondrial fusion and fission. Biochim Biophys Acta 1817 : 1833–1838. doi: 10.1016/j.bbabio.2012.02.033 22409868
40. Horan MP, Pichaud N, Ballard JW (2012) Review: quantifying mitochondrial dysfunction in complex diseases of aging. The journals of gerontology Series A, Biological sciences and medical sciences 67 : 1022–1035. doi: 10.1093/gerona/glr263 22459622
41. Dejean L, Beauvoit B, Guerin B, Rigoulet M (2000) Growth of the yeast Saccharomyces cerevisiae on a non-fermentable substrate: control of energetic yield by the amount of mitochondria. Biochim Biophys Acta 1457 : 45–56. doi: 10.1016/S0005-2728(00)00053-0 10692549
42. Sadeh A, Movshovich N, Volokh M, Gheber L, Aharoni A (2011) Fine-tuning of the Msn2/4-mediated yeast stress responses as revealed by systematic deletion of Msn2/4 partners. Mol Biol Cell 22 : 3127–3138. doi: 10.1091/mbc.E10-12-1007 21757539
43. Hedbacker K, Carlson M (2008) SNF1/AMPK pathways in yeast. Front Biosci 13 : 2408–2420. doi: 10.2741/2854 17981722
44. Salminen A, Kaarniranta K (2012) AMP-activated protein kinase (AMPK) controls the aging process via an integrated signaling network. Ageing Res Rev 11 : 230–241. doi: 10.1016/j.arr.2011.12.005 22186033
45. Vincent O, Townley R, Kuchin S, Carlson M (2001) Subcellular localization of the Snf1 kinase is regulated by specific beta subunits and a novel glucose signaling mechanism. Genes & development 15 : 1104–1114. doi: 10.1101/gad.879301
46. Schmidt MC, McCartney RR (2000) beta-subunits of Snf1 kinase are required for kinase function and substrate definition. EMBO J 19 : 4936–4943. doi: 10.1093/emboj/19.18.4936 10990457
47. Zaman S, Lippman SI, Zhao X, Broach JR (2008) How Saccharomyces responds to nutrients. Annual review of genetics 42 : 27–81. doi: 10.1146/annurev.genet.41.110306.130206 18303986
48. Westholm JO, Nordberg N, Muren E, Ameur A, Komorowski J, et al. (2008) Combinatorial control of gene expression by the three yeast repressors Mig1, Mig2 and Mig3. BMC genomics 9 : 601. doi: 10.1186/1471-2164-9-601 19087243
49. Nehlin JO, Ronne H (1990) Yeast MIG1 repressor is related to the mammalian early growth response and Wilms’ tumour finger proteins. EMBO J 9 : 2891–2898. 2167835
50. Westergaard SL, Oliveira AP, Bro C, Olsson L, Nielsen J (2007) A systems biology approach to study glucose repression in the yeast Saccharomyces cerevisiae. Biotechnol Bioeng 96 : 134–145. doi: 10.1002/bit.21135 16878332
51. Ahuatzi D, Riera A, Pelaez R, Herrero P, Moreno F (2007) Hxk2 regulates the phosphorylation state of Mig1 and therefore its nucleocytoplasmic distribution. J Biol Chem 282 : 4485–4493. doi: 10.1074/jbc.M606854200 17178716
52. Harkness TA, Shea KA, Legrand C, Brahmania M, Davies GF (2004) A functional analysis reveals dependence on the anaphase-promoting complex for prolonged life span in yeast. Genetics 168 : 759–774. doi: 10.1534/genetics.104.027771 15514051
53. Fernandez-Cid A, Riera A, Herrero P, Moreno F (2012) Glucose levels regulate the nucleo-mitochondrial distribution of Mig2. Mitochondrion 12 : 370–380. doi: 10.1016/j.mito.2012.02.001 22353369
54. Moreno F, Ahuatzi D, Riera A, Palomino CA, Herrero P (2005) Glucose sensing through the Hxk2-dependent signalling pathway. Biochem Soc Trans 33 : 265–268. doi: 10.1042/BST0330265 15667322
55. Schuurmans JM, Rossell SL, van Tuijl A, Bakker BM, Hellingwerf KJ, et al. (2008) Effect of hxk2 deletion and HAP4 overexpression on fermentative capacity in Saccharomyces cerevisiae. FEMS yeast research 8 : 195–203. doi: 10.1111/j.1567-1364.2007.00319.x 18179578
56. Kaeberlein M, McVey M, Guarente L (1999) The SIR2/3/4 complex and SIR2 alone promote longevity in Saccharomyces cerevisiae by two different mechanisms. Genes & development 13 : 2570–2580. doi: 10.1101/gad.13.19.2570
57. Lan F, Cacicedo JM, Ruderman N, Ido Y (2008) SIRT1 modulation of the acetylation status, cytosolic localization, and activity of LKB1. Possible role in AMP-activated protein kinase activation. J Biol Chem 283 : 27628–27635. doi: 10.1074/jbc.M805711200 18687677
58. Canto C, Gerhart-Hines Z, Feige JN, Lagouge M, Noriega L, et al. (2009) AMPK regulates energy expenditure by modulating NAD+ metabolism and SIRT1 activity. Nature 458 : 1056–1060. doi: 10.1038/nature07813 19262508
59. Wang Y, Liang Y, Vanhoutte PM (2011) SIRT1 and AMPK in regulating mammalian senescence: a critical review and a working model. FEBS Lett 585 : 986–994. doi: 10.1016/j.febslet.2010.11.047 21130086
60. Baraibar MA, Friguet B (2012) Changes of the proteasomal system during the aging process. Prog Mol Biol Transl Sci 109 : 249–275. doi: 10.1016/B978-0-12-397863-9.00007-9 22727424
61. Segref A, Kevei E, Pokrzywa W, Schmeisser K, Mansfeld J, et al. (2014) Pathogenesis of human mitochondrial diseases is modulated by reduced activity of the ubiquitin/proteasome system. Cell Metab 19 : 642–652. doi: 10.1016/j.cmet.2014.01.016 24703696
62. Fukui H, Moraes CT (2007) Extended polyglutamine repeats trigger a feedback loop involving the mitochondrial complex III, the proteasome and huntingtin aggregates. Hum Mol Genet 16 : 783–797. doi: 10.1093/hmg/ddm023 17356014
63. Livnat-Levanon N, Kevei E, Kleifeld O, Krutauz D, Segref A, et al. (2014) Reversible 26S Proteasome Disassembly upon Mitochondrial Stress. Cell reports 7 : 1371–1380. doi: 10.1016/j.celrep.2014.04.030 24857655
64. Wang X, Yen J, Kaiser P, Huang L (2010) Regulation of the 26S proteasome complex during oxidative stress. Sci Signal 3: ra88. doi: 10.1126/scisignal.2001232 21139140
65. Sullivan PG, Dragicevic NB, Deng JH, Bai Y, Dimayuga E, et al. (2004) Proteasome inhibition alters neural mitochondrial homeostasis and mitochondria turnover. J Biol Chem 279 : 20699–20707. doi: 10.1074/jbc.M313579200 14742431
66. Tsakiri EN, Sykiotis GP, Papassideri IS, Terpos E, Dimopoulos MA, et al. (2013) Proteasome dysfunction in Drosophila signals to an Nrf2-dependent regulatory circuit aiming to restore proteostasis and prevent premature aging. Aging cell 12 : 802–813. doi: 10.1111/acel.12111 23738891
67. Malc E, Dzierzbicki P, Kaniak A, Skoneczna A, Ciesla Z (2009) Inactivation of the 20S proteasome maturase, Ump1p, leads to the instability of mtDNA in Saccharomyces cerevisiae. Mutation research 669 : 95–103. doi: 10.1016/j.mrfmmm.2009.05.008 19467248
68. Lin SS, Manchester JK, Gordon JI (2003) Sip2, an N-myristoylated beta subunit of Snf1 kinase, regulates aging in Saccharomyces cerevisiae by affecting cellular histone kinase activity, recombination at rDNA loci, and silencing. J Biol Chem 278 : 13390–13397. doi: 10.1074/jbc.M212818200 12562756
69. Marino G, Ugalde AP, Salvador-Montoliu N, Varela I, Quiros PM, et al. (2008) Premature aging in mice activates a systemic metabolic response involving autophagy induction. Hum Mol Genet 17 : 2196–2211. doi: 10.1093/hmg/ddn120 18443001
70. Delaney JR, Murakami C, Chou A, Carr D, Schleit J, et al. (2013) Dietary restriction and mitochondrial function link replicative and chronological aging in Saccharomyces cerevisiae. Experimental gerontology 48 : 1006–1013. doi: 10.1016/j.exger.2012.12.001 23235143
71. Kaeberlein M, Kirkland KT, Fields S, Kennedy BK (2005) Genes determining yeast replicative life span in a long-lived genetic background. Mech Ageing Dev 126 : 491–504. doi: 10.1016/j.mad.2004.10.007 15722108
72. Rolland F, Winderickx J, Thevelein JM (2002) Glucose-sensing and -signalling mechanisms in yeast. FEMS yeast research 2 : 183–201. doi: 10.1016/S1567-1356(02)00046-6 12702307
73. Finley LW, Haigis MC (2009) The coordination of nuclear and mitochondrial communication during aging and calorie restriction. Ageing Res Rev 8 : 173–188. doi: 10.1016/j.arr.2009.03.003 19491041
74. Imai S, Armstrong CM, Kaeberlein M, Guarente L (2000) Transcriptional silencing and longevity protein Sir2 is an NAD-dependent histone deacetylase. Nature 403 : 795–800. doi: 10.1038/35001622 10693811
75. Brachmann CB, Davies A, Cost GJ, Caputo E, Li J, et al. (1998) Designer deletion strains derived from Saccharomyces cerevisiae S288C: a useful set of strains and plasmids for PCR-mediated gene disruption and other applications. Yeast 14 : 115–132. doi: 10.1002/(SICI)1097-0061(19980130)14 : 2%3C115::AID-YEA204%3E3.0.CO;2-2 9483801
76. Horecka J, Davis RW (2014) The 50 : 50 method for PCR-based seamless genome editing in yeast. Yeast 31 : 103–112. doi: 10.1002/yea.2992 24639370
77. Sesaki H, Jensen RE (1999) Division versus fusion: Dnm1p and Fzo1p antagonistically regulate mitochondrial shape. J Cell Biol 147 : 699–706. doi: 10.1083/jcb.147.4.699 10562274
78. Naylor K, Ingerman E, Okreglak V, Marino M, Hinshaw JE, et al. (2006) Mdv1 interacts with assembled dnm1 to promote mitochondrial division. J Biol Chem 281 : 2177–2183. doi: 10.1074/jbc.M507943200 16272155
79. Kushnirov VV (2000) Rapid and reliable protein extraction from yeast. Yeast 16 : 857–860. doi: 10.1002/1097-0061(20000630)16 : 9%3C857::AID-YEA561%3E3.0.CO;2-B 10861908
80. Collins GA, Gomez TA, Deshaies RJ, Tansey WP (2010) Combined chemical and genetic approach to inhibit proteolysis by the proteasome. Yeast 27 : 965–974. doi: 10.1002/yea.1805 20625982
Štítky
Genetika Reprodukčná medicínaČlánok vyšiel v časopise
PLOS Genetics
2015 Číslo 1
- Gynekologové a odborníci na reprodukční medicínu se sejdou na prvním virtuálním summitu
- Je „freeze-all“ pro všechny? Odborníci na fertilitu diskutovali na virtuálním summitu
Najčítanejšie v tomto čísle
- The Global Regulatory Architecture of Transcription during the Cell Cycle
- A Truncated NLR Protein, TIR-NBS2, Is Required for Activated Defense Responses in the Mutant
- Proteasomes, Sir2, and Hxk2 Form an Interconnected Aging Network That Impinges on the AMPK/Snf1-Regulated Transcriptional Repressor Mig1
- The SWI2/SNF2 Chromatin Remodeler BRAHMA Regulates Polycomb Function during Vegetative Development and Directly Activates the Flowering Repressor Gene