
The Epstein-Barr Virus Encoded BART miRNAs Potentiate Tumor Growth
Epstein-Barr virus is a herpes virus that persistently infects essentially every human being for life. It also has the ability to latently infect B lymphocytes and cause them to proliferate indefinitely in culture, and is associated with several forms of carcinoma and lymphoma. The virus contains genes for ~30 miRNAs in its BART region. The functions of these miRNAs are mostly unknown, but it is clear that they are not required to drive the growth of infected cells in vitro. We have shown previously, however, that these miRNAs are all highly expressed in the EBV associated cancers and that their expression is deregulated suggesting they may play a role in vivo. Until now, the significance of BART miRNAs to tumor development in vivo was unknown. Here we have used a mouse xenograft model to show that these miRNAs, while having little or no discernible effect on the growth of infected cells in vitro, potentiate the seeding and growth of EBV associated tumors in vivo.
Published in the journal:
The Epstein-Barr Virus Encoded BART miRNAs Potentiate Tumor Growth. PLoS Pathog 11(1): e32767. doi:10.1371/journal.ppat.1004561
Category:
Research Article
doi:
https://doi.org/10.1371/journal.ppat.1004561
Summary
Epstein-Barr virus is a herpes virus that persistently infects essentially every human being for life. It also has the ability to latently infect B lymphocytes and cause them to proliferate indefinitely in culture, and is associated with several forms of carcinoma and lymphoma. The virus contains genes for ~30 miRNAs in its BART region. The functions of these miRNAs are mostly unknown, but it is clear that they are not required to drive the growth of infected cells in vitro. We have shown previously, however, that these miRNAs are all highly expressed in the EBV associated cancers and that their expression is deregulated suggesting they may play a role in vivo. Until now, the significance of BART miRNAs to tumor development in vivo was unknown. Here we have used a mouse xenograft model to show that these miRNAs, while having little or no discernible effect on the growth of infected cells in vitro, potentiate the seeding and growth of EBV associated tumors in vivo.
Introduction
Epstein-Barr virus (EBV) is a ubiquitous human herpes virus. It infects virtually every human being for life and in the overwhelming number of people this persistent infection is benign [1]. The virus achieves this by entering into a quiescent latent state within circulating, resting, memory B lymphocytes where no viral proteins are expressed [2, 3]. However, in order to achieve this state the virus needs to latently infect naïve B lymphocytes and drive them to become activated proliferating lymphoblasts (growth transcription program\Latency III) so that they can then differentiate through the germinal center to become latently infected, resting memory B cells. This ability to drive B cell proliferation has long been believed to explain why EBV is associated with several forms of cancer, including lymphomas (Burkitt’s (BL) and Hodgkin’s (HD)) and carcinomas (nasopharyngeal (NPC) and gastric (GaCa)) [1, 4]. However, a major inconsistency with this idea was uncovered when detailed analysis of viral latent protein expression was performed on infected cells in vivo and in tumor cells. These studies revealed that the tumors do not express the full panoply of potentially oncogenic, growth promoting, EBV latent proteins found in the growth program. Rather, the EBV gene expression profiles seen in the tumors reflects those found at specific stages of B cell infection in vivo [4]. This finding has led to the proposal that the tumors arise directly from these infected B cell types. In the most extreme case (BL), only one viral protein is expressed, EBNA1 [5, 6] which is the gene expression pattern characteristic of latently infected memory B cells [7] when they divide. These counterintuitive observations strongly imply that the virus has evolved to minimize the oncogenic risk posed by the growth program/Latency III latent proteins, which otherwise would threaten the host within which the virus persists.
On the other hand, it is well known that the EBV episome, or plasmids derived from it, will be rapidly lost if there is no selective advantage to their retention [8–11]. The persistence of the viral episome within the tumors therefore implies that the virus must be contributing to the growth and/or survival of the tumors [8, 12–17]. Since most of the growth promoting EBV latent proteins are absent, the question arises as to what the virus is contributing to the tumors that causes the viral episome to be retained. Recently, attention has become focused on abundant non-coding EBV RNAs [18–23]. These include ~40 miRNAs, four of which are encoded from the BHRF region and the remainder from the BART region. We have shown that all of the BART miRNAs are highly expressed in all of the tumor types, especially the carcinomas [22, 24]. This includes a subset of the BART miRNAs whose expression in vivo is specifically associated only with the Latency III growth program (Latency III associated BART miRNAs) and thus, would not be expected to be associated with the viral latency programs found in the tumors (Latency I or II). To date, this represents the only example of inappropriate expression of Latency III growth program genes in the tumors and suggests that these miRNAs may play a role in tumor development.
Although the functions of most of the BART miRNAs remains unresolved several in vitro studies have suggested that they may contribute to oncogenesis. BL-derived cell lines with constitutive expression of BART miRNAs are able to inhibit apoptosis induced by the loss of EBV in vitro, implicating a survival role for BART miRNAs in BLs [25]. BART 5 represses the p53 up-regulated modulator of apoptosis (PUMA), thereby protecting EBV-infected cells from virally-induced apoptosis and in addition high expression of BART 5 correlates with the low abundance of PUMA in NPC tissues [26]. BART 13* likely plays an anti-apoptotic role by targeting the Wnt-signalling enhancer CAPRIN2 [27], Bart 3* suppresses the DICE1 tumor suppressor to promote cellular growth [28] and BART Cluster 1 miRNAs are able to suppress the Bcl-2 interacting mediator of cell death (Bim), thus protecting cells from apoptosis [29]. However, until now no data in support of a role for the EBV BART miRNAs in tumorigenesis in vivo has been presented. Since it is not possible to study the tumors in situ in humans, we developed a mouse model of one (NPC) [30]. In this paper we use this in vivo model to demonstrate that the miRNAs confer a significant growth advantage to EBV associated tumors in vivo.
Results
Up regulation of EBV BART miRNAs in nasopharyngeal carcinoma in vivo
We have previously reported an orthotopic mouse model which faithfully recapitulates locally invasive and metastatic EBV-positive nasopharyngeal carcinoma (NPC) [30]. In this model, luciferase-tagged C666–1 cells were injected into the nasopharyngeal epithelium of the highly immune deficient mouse strain NOD.Cg-PrkdcscidIl2rgtm1Wjl/SzJ (NSG). To gain insight into the possible role of EBV BART miRNAs in tumorigenesis we wished to ascertain if tumor growth and/or metastasis in this model was associated with preferential expression of specific BART miRNAs. Therefore, we examined the BART miRNA expression profiles of C666–1 cells before and after inoculation and growth as tumors in the NSG mouse model and then again after the tumors had been explanted and grown in vitro. A complete description of the parental lines, tumors, and tumor explant cultures developed and used in this study is given in S1 and S2 Tables. To profile the BART miRNAs we employed a PCR based assay that we have characterized in detail previously [24]. This assay will detect ≤10 copies of each mRNA with a linear response up to ≥108 copies. It has the advantage that it allows the quantitative profiling of the expression of a large number of miRNAs from small tissue samples that otherwise would be impossible to study, such as human tissue biopsies and the moue tumors studied here.
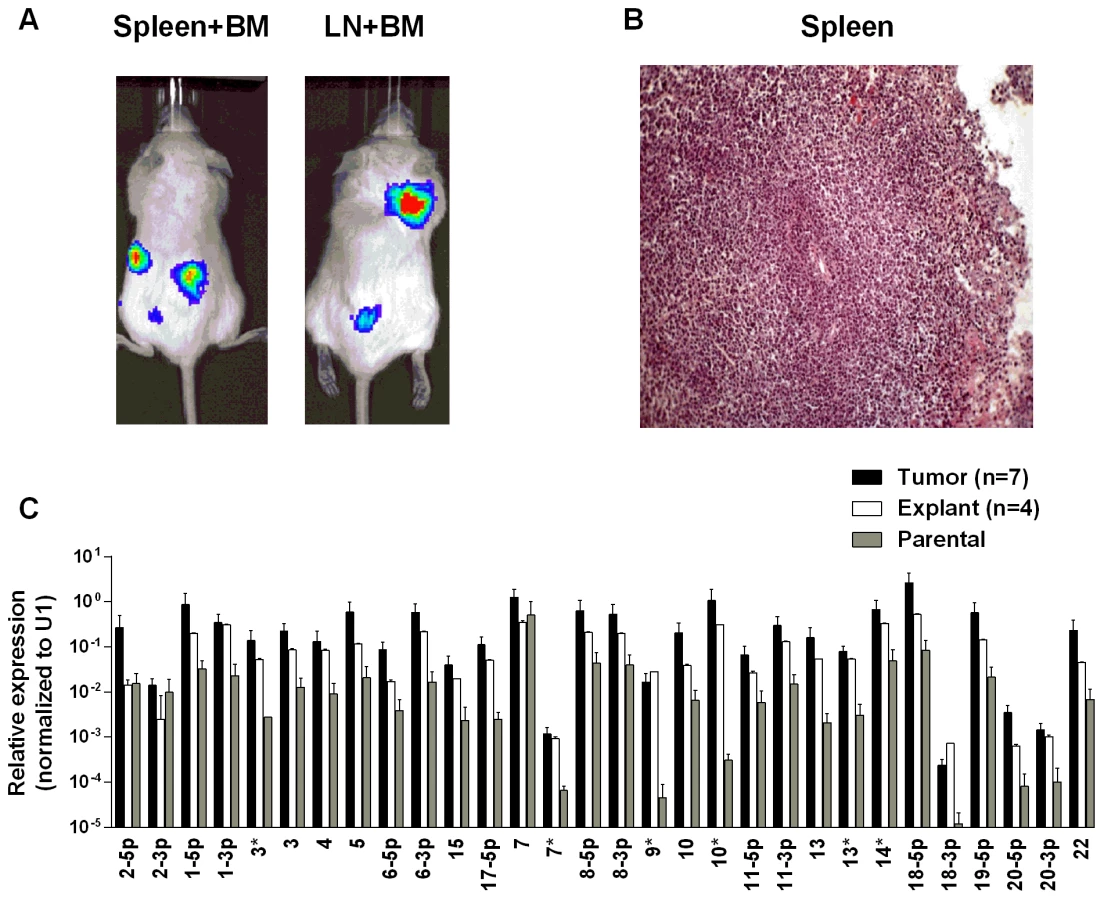
Fig. 1A and B show examples of C666–1 derived tumors grown in the NSG mouse model. The miRNA profiles of the cell lines before, during and after growth as tumors are shown in Fig. 2A. We did not observe specific changes in individual miRNAs rather all of the BART miRNAs were significantly up regulated when the cells grew as tumors in vivo compared to the parental lines (p<0.001). When the tumors were explanted for culture in vitro to become cell lines, the miRNA expression declined again to that of the parental line. However, this decline was fully reversible since upon reinjection back into the mice, the miRNA level again increased. In all, this process was reiterated three times with the same result, up regulation in vivo and down regulation in vitro (not shown). This suggests that increased expression of the BART miRNAs may confer a growth advantage to the tumor cells in vivo. Two of the three BHRF1 miRNAs also showed elevated copy numbers in the tumors although their expression levels were modest when compared to the BART miRNAs (not shown).


Metastasis is generally characterized by expression of the signature protein Snail a key transcriptional factor in epithelial mesenchymal transition that is known to promote metastasis [31]. As expected, Snail expression was greatly increased in the C666–1 metastases compared to the primary tumors (Fig. 3A). However, when we compared the BART miRNA expression profiles of primary tumors with metastasis they were indistinguishable (Fig. 3B). Indeed we have developed a highly metastatic derivative of the C666–1 tumor with a 100% metastasis rate in mice and even these cells showed no variation in BART miRNA expression (not shown). Thus, this analysis did not detect a correlation between EBV BART miRNA expression and metastasis.

Up regulation of EBV BART miRNAs in gastric carcinoma in vivo
We wished to confirm these findings in a second carcinoma model therefore we chose to study the gastric carcinoma (GaCa) cell line AGS-BX1. Successful engraftment of immunosuppressed mice with this cell line has not been reported previously. Consistent with this, mice injected subcutaneously with 107 AGS-BX1 cells failed to develop tumors (not shown). Interestingly though, 4 out of 10 mice injected in the nasopharyngeal epithelium (I.N.) grew tumors, with metastatic dissemination being observed in 3 of the mice (Fig. 1 C and D) suggesting that this is also a good model to study GaCa in vivo. We profiled the BART miRNA expression levels in the parental line, tumors and explants and observed similar results to those seen with the NPC model (Fig. 2B). Although not as large as the NPC line, the increase in BART miRNA expression in the tumors was nevertheless substantial when compared to the parental line (p<0.001). However, again no significant difference was seen between the primaries and metastases (Fig. 3 C and D) and the expression level decreased when the tumors were grown in vitro. The extent of reduction was not as dramatic as that seen with NPC and had not returned to the levels seen in the parental line at the time the cells were tested. This likely reflects the fact that the AGS-BX1 explant lines were grown for a much shorter time in vitro then the NPC lines and may not have had sufficient time to fully reduce their expression level.
Specificity of the BART miRNA up regulation in tumors
To discover if the up regulation of the BART miRNAs was specific to the viral miRNAs or represented a more general phenomenon we first examined the expression of three cellular miRNAs mir-9, mir-34a and mir-26a. As seen in Figs. 4 A and C all three cellular miRNAs tested were expressed at similar levels in the parental lines, tumors and in the explanted tumor cells grown in vitro. A trend was observed as with the BART miRNAs in that levels were slightly higher in the tumors and tended to decrease again in the explants. However, these changes were not consistent (mir-9 was mostly highly expressed in the NPC explants) and did not always achieve statistical significance. In particular changes in the GaCa cells never achieved significance. Thus, unlike the BART miRNAs, the cellular miRNA increases were small and not reproducible between different cell types. This study confirms that the up regulation we have observed in BART miRNA expression in vivo was not a consequence of a global increase in the production of all miRNAs.

We also tested mRNA levels for two cellular genes that are associated with epithelial mesenchymal transition, CDH1 and Snail [32, 33] (Fig. 4 B and D). While the levels of CDH1 remained unchanged, Snail levels actually decreased in the tumors compared to the parental or explanted tumor cells grown in vitro for both NPC and GaCa. These results demonstrate that the increased expression of the BART miRNAs was not a consequence of a general up regulation in gene expression.
Lastly, we checked the mRNA levels of EB viral latent genes including the small viral RNA EBER1 (Fig. 4 B and D). The levels of all three were higher in the tumors for both the NPC and the GaCa cells when compared to the parental lines. However, the levels of the EBNA1 and LMP1 transcripts were strikingly up regulated for the NPC tumors suggesting that these latent proteins might also play a role in NPC tumor growth.
We conclude that there is an increase in the expression of the BART miRNAs when EBV positive carcinoma cells are grown as tumors in vivo and this is reversed upon re-culture in vitro. However, we saw no consistent changes in BART expression when tumors underwent metastasis. This suggests that the BART miRNAs may confer a significant growth advantage to EBV positive tumor cells in vivo that is not reiterated in vitro.
The up regulation of EBV BART miRNAs in vivo is not carcinoma specific
To test whether the up regulation of BART miRNAs is tissue specific, i.e. restricted to the carcinomas, we evaluated their expression in a B cell lymphoma. Single cell suspensions of the luciferase tagged EBV-positive BL (BL36) cells could not be successfully injected into the nasopharyngeal epithelial tissue of NSG mice, therefore we injected them intravenously into the tail vein. Lymphoma developed in all injected animals (Fig. 5A and B). For a detailed description and account of the tumors used in this study see S1 and S2 Tables. Upon profiling the BART miRNA expression pattern we saw a similar result to that obtained with the carcinomas. The expression level of all the BART miRNAs was up regulated (p<0.001), when compared with the parental line (Fig. 5C). As with the carcinomas this effect was reversible when the tumors were re-cultured in vitro.
EBV BART miRNAs potentiate tumor growth in vivo
We have reported here an increased expression of the BART miNAs in EBV associated tumors in vivo that is not due to a general increase in cellular transcription but may be associated with increases in expression levels of other viral latent genes. To assess the contribution of the BART miRNAs alone to tumor development we took advantage of an EBV negative derivative (AGS) of the AGS-BX1 GaCa cell line. Luciferase tagged AGS cells were transfected with either an empty oriP/EBNA1 vector (AGS-EBNA1-EMPTY) or one that expresses all of the BART miRNAs (AGS-EBNA1-BART) [25]. These cells were then inoculated into the nasopharynx of NSG mice and tumor growth and metastasis in vivo were monitored (Fig. 6). After 60 days, 2 of 5 control mice had developed small but detectable tumors. Strikingly however, all 5 mice with AGS-EBNA1-BART (100% incidence) had malignancies, indicating that the BART miRNAs promote tumor formation. Furthermore, the BART-expressing tumors appeared to be more aggressive, as these mice deteriorated rapidly, developing large tumors and requiring sacrifice beginning at day 74. In contrast, by this time, still only two control mice showed detectable tumors that remained small and the mice appeared healthy. Thus, BART miRNAs enhanced both the rate of tumor formation (p = 0.03 by Fishers exact test at day 74) and tumor progression/fatality (p = 0.03 by Fishers exact test at day 88).
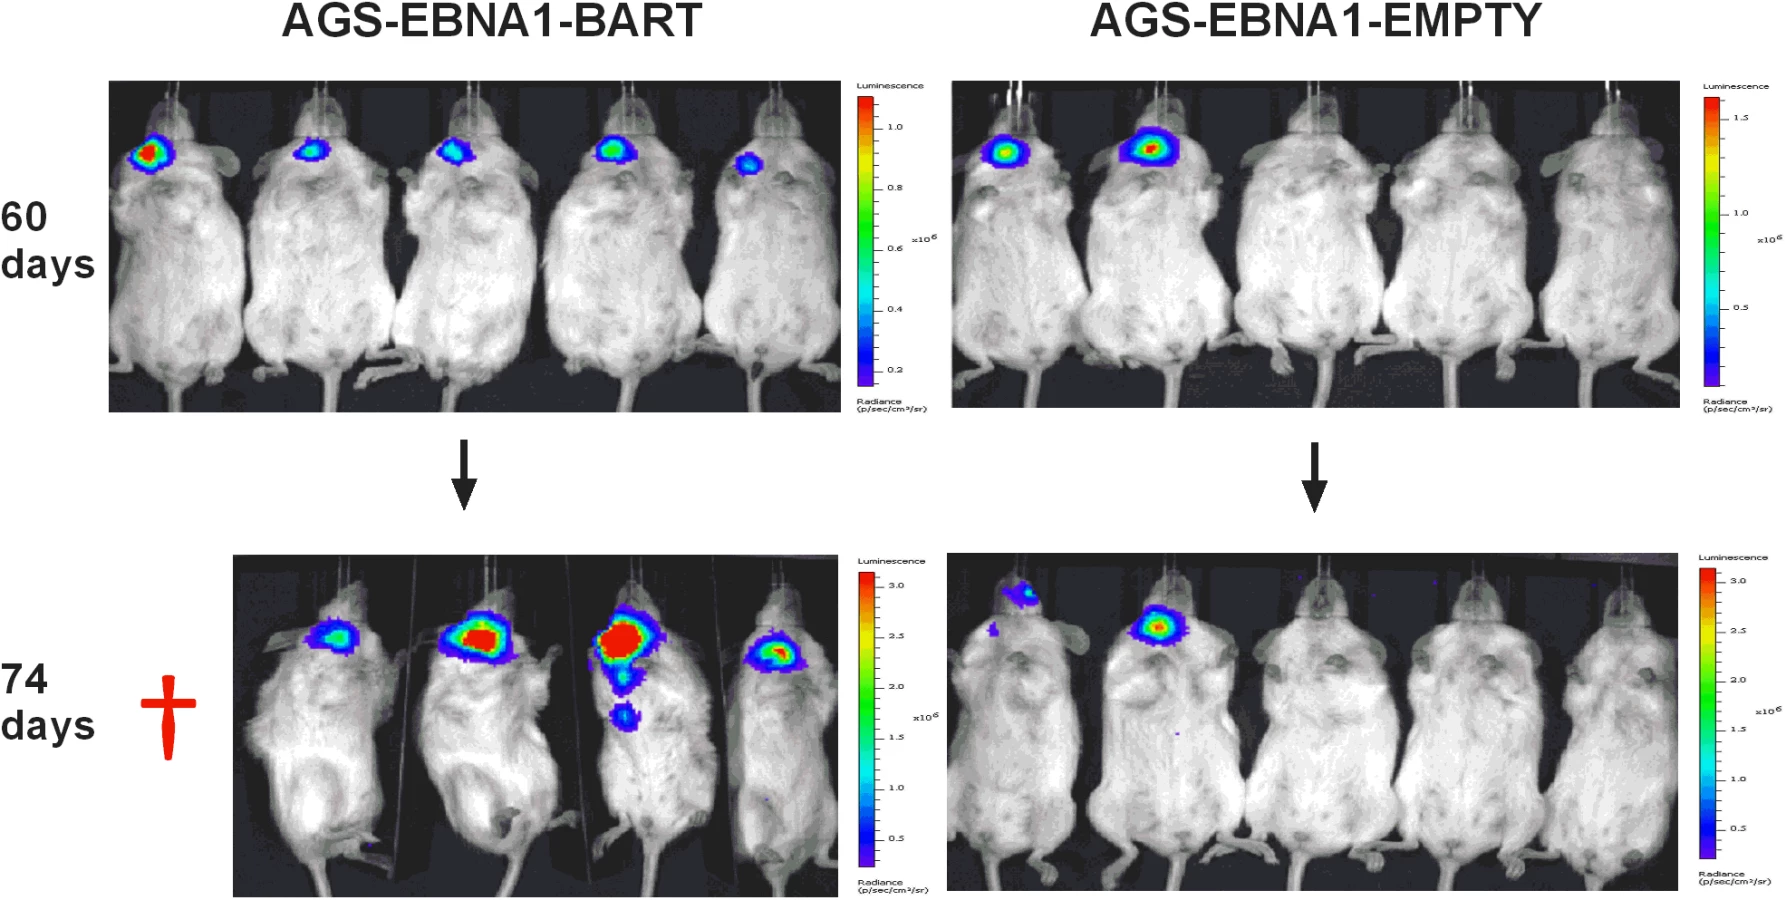
Kaplan Meier analysis of the complete data set combined from two such experiments confirmed that the AGS-EBNA1-BART mice exhibited a significantly higher overall level and rate of mortality relative to the AGS-EBNA1-EMPTY mice (Fig. 7A, p = 0.017). The more aggressive nature of the BART+ tumors was confirmed by measurement of the tumor burden in the two populations of mice. The combined data from two experiments is shown in Fig. 7B. No differences in tumor burden (measured as luciferase radiance) were evident between the two groups on day 60, but subsequently differences became apparent as the tumors progressed. By day 74, when most of the AGS-EBNA1-BART mice needed to be sacrificed, the tumor burden was approximately 10-fold higher than that of the AGS-EBNA1-EMPTY (~1.4×10⁶ p/s/cm2/sr in BART+ vs 1.5×10⁵ p/s/cm2/sr in EMPTY), suggesting that the BART miRNAs promote tumor growth in vivo. By taking measurements of luciferase emission from the same tumors over time it was possible to estimate their relative growth rates. This estimate suggested that the AGS-EBNA1-BART tumors were growing approximately twice as fast as the AGS-EBNA1-EMPTY tumors. We conclude that the BART miRNAs strongly promote tumor growth in vivo.

The BART miRNAs promote tumor cell growth
When we measured the BART miRNA expression profiles in the parental AGS-EBNA1-BART line and the tumors we observed the same effect as with the EBV positive tumor lines. We did not observe differential expression of the BART miRNAs rather all of the BART miRNAs were elevated in the in vivo tumors (Fig. 8A). For a list of all tumors and cells used for profiling see S1 and S2 Tables. This result confirms that BART miRNA up regulation in vivo is specific and not simply an indirect consequence of a general increase in viral latent gene expression.

Insight into the mechanism by which the BART miRNAs potentiated tumor growth was provided by in vitro analysis of AGS-EBNA1-BART and AGS-EBNA1-EMPTY tumors immediately after explant. Both AGS-EBNA1-EMPTY and AGS-EBNA1-BART parental lines grew at identical rates in culture prior to inoculation (Fig. 8B). However, after explant the AGS-EBNA1-BART tumor cells grew significantly faster (~60% faster) than the AGS-EBNA1-EMPTY tumor cells (Fig. 8C). AGS-EBNA1-BART tumors cells also showed a slightly higher rate of colony formation after explantation (S1A and B Fig.). Surprisingly, in light of recent studies on the effects of BART miRNAs on AGS cells in vitro [29] we observed no difference in the levels of apoptosis between the BART positive and BART negative parental lines when treated with the DNA damaging agent etoposide (S1C Fig.). We did observe a small decrease in sensitivity for the AGS-EBNA1-BART tumor explants when compared to AGS-EBNA1-EMPTY tumors. (8% specific reduction in apoptotic cells) (S1D Fig.) Although the differences in colony formation and apoptosis were statistically significant they were small suggesting that the main effect of the BART miRNAs is to provide a growth advantage to the tumors that is seen in vivo and detected upon immediate culture of the explants but lost after long term in vitro culture
These data suggests that the up regulated expression of the BART miRNAs confers a selective advantage to tumor growth in vivo that is not seen in vitro. Furthermore, they demonstrate a direct link between the up regulation of the BART miRNAs, that we have consistently observed with tumors in vivo, and enhanced tumor growth.
BART expressing plasmids are preferentially retained in tumors
Plasmids constructed from an EBV oriP/EBNA1 vector do not integrate into the host genome when transfected into cells, but instead persist episomally [11]. However, these episomes are rapidly lost in the absence of selection pressure for their retention [9, 11, 34]. In the presence of drug selection the parental lines maintained ~450–500 copies of the EBNA1-BART and EBNA1-EMPTY plasmids per cell and as expected, both plasmids were lost when the lines were cultured in the absence of drug selection (not shown). This is consistent with our conclusion that the BART miRNAs do not convey a growth advantage to cells in vitro. Analysis of the plasmid copy numbers from a collection of the tumors (Table 1) revealed that the plasmid had been lost from the AGS EBNA1-EMPTY tumors (n = 4), which had an average copy number of less than 1 per cell (0.1±0.1 episomes per cell). However, the AGS EBNA1-BART tumors (n = 6), retained an average of 8.9±3.5 episome copies per cell (p = <0.001) which were only lost when the tumors were explanted and grown again in culture. Thus, the lack of drug selection in vivo, caused a precipitous drop in plasmid copy number for both cell types resulting in the loss of all the EBNA1-EMPTY plasmids whereas the EBNA1-BART plasmids were stably retained at around 5–10 copies per cell. In parallel, the level of BART miRNA expression increased. Therefore, amplification of the episome copy number cannot explain the increased expression of the miRNAs in the tumors. This result demonstrates that expression of the BART miRNAs confers a selective advantage to the tumor cells in vivo that alone is sufficient to ensure retention of the plasmid that expresses them and confirms that this advantage applies to in vivo but not in vitro growth.

We conclude that the EBV BART miRNAs do not provide a detectable growth or survival advantage when the cells expressing them are grown in vitro. However, in vivo they provide a pronounced advantage to the tumors specifically causing them to be seeded more efficiently and grow faster and more aggressively.
BART miRNA expression does not affect invasion/metastasis
Next we asked if expression of the EBV miRNAs in AGS cells would provide for a higher rate of metastasis. For mice receiving AGS-EBNA1-EMPTY cells, 4 out of 6 mice with tumors (66.7%) developed metastases (Fig. 9A), whereas only 3 out of 8 mice with AGS-EBNA1-BART tumors (37.5%) developed metastases. Although these numbers do not achieve statistical significance, they are consistent with a trend that the BART miRNAs do not exacerbate metastasis and might actually impede it.

Lastly, we asked if the BART miRNAs could confer a more invasive phenotype to the tumor cells, as cell invasion is a critical step in metastasis. To test this we performed trans-well Matrigel invasion assays comparing AGS-EBNA1-EMPTY cells with AGS-EBNA1-BART cells. In this assay, the ability of cells to invade through an extracellular matrix of a Matrigel-coated porous membrane in response to chemoattractants is assessed. After a 24 hour incubation, the AGS-EBNA1-BART cells demonstrated a slightly less invasive phenotype than did the AGS-EBNA1-EMPTY cells, as the absolute cell numbers of AGS-EBNA1-EMPTY on the trans-side (migrated cells) were around 2-fold higher than that of AGS-EBNA1-BART (Fig. 9B and C), suggesting that EBV BART miRNAs may also have a negative effect on invasion. We conclude that our experiments provide no evidence for BART miRNAs contributing positively to invasion and/or metastasis.
Discussion
In this paper we have demonstrated that the EBV encoded BART miRNAs confer a selective growth advantage to EBV positive tumor cells in vivo. This growth promotion occurs in parallel with an up regulation in the expression of all the BARTs. Furthermore, elevated expression of the BART miRNAs in vivo was observed for every EBV positive tumor type we tested. This suggests that the BART miRNAs confer a growth advantage to all EBV positive tumors.
The lack of a readily accessible and manipulable animal model of EBV infection and tumorigenesis means that most studies on the virus’s biology must be conducted in vitro. Thus to date, all studies on BART miRNA functions have been performed in vitro and have yet to be verified or shown to be biologically meaningful in an in vivo setting. Lacking evidence from humans, mouse models can provide an alternate approach to investigate the role of EBV encoded genes in vivo. Inoculation of immunocompromised mice (e.g. severe combined immune deficiency or SCID mice) with EBV-positive tumor-derived cell lines has been extensively used to study the role of the virus in tumorigenesis [30, 35–41]. However, these models rarely, if ever, recapitulate key aspects of the tumors behavior, such as invasion and metastasis. We have previously described a mouse model that accurately reproduces locally invasive and metastatic EBV-positive carcinoma [30] and have applied this model here to study the role of the EBV BART miRNAs in tumor development. We have shown that expression of the BART miRNAs resulted in more efficient tumor seeding, larger tumors and higher and more rapid mortality. Indeed the tumor burden in the BART+ mouse group was ~10 times greater after 74 days of growth in vivo than with the BART - group. Furthermore, the newly explanted tumors grew 60% faster in culture if they expressed the BART miRNAs, an increase in growth rate sufficient to account for the differences seen in vivo. However, this effect was not sustained in long term cultures. Although we cannot definitely rule out other activities for the miRNAs in tumor development we saw only minimal changes in other functions we assayed including colony formation and resistance to apoptosis. For example, we confirmed the work of others that the BART miRNAs had an anti-apoptotic effect [25–29], However, this effect was very modest in our system and only detectable after in vivo growth. Contrary to previous findings [29] we did not observe any effect of the BART miRNAs on apoptosis when expressed in AGS carcinoma cells in vitro.
Independent proof that expression of the BART miRNAs conferred a selective growth advantage in vivo was provided by the observations on plasmid retention. OriP based plasmids do not integrate, but persist as episomes that are lost unless selective pressure is applied for their retention [11]. The retention of the EBV episome has been interpreted as compelling evidence that the virus is involved in the development in EBV positive tumors [12–15, 17]. Thus our observation that the BART expressing oriP plasmids (EBNA1-BART) were similarly retained in the tumor cells in vivo, whereas the empty vector (EBNA1-EMPTY) was lost, supports our conclusion that the BART miRNAs contribute to tumor growth. It follows that expression of the BART miRNAs is responsible in part for the retention of EBV in human tumors. Confirmation that our observation was an in vivo phenomenon came from the finding that both plasmids were lost from the cells in culture. These plasmids were not only selectively retained in vivo, but the BART miRNAs were expressed in the tumors at a much higher level than in the parental line grown in vitro, demonstrating a direct link between high BART copy number and rapid tumor growth. It is interesting to note that the EBNA1-EMPTY plasmid was lost in vivo, even though it expresses the viral tethering protein EBNA1 and we did not see an increase in EBNA1 expression when the AGS-EBNA1-BART in vitro lines grew as tumors in the mice (not shown) Together these observations suggest that EBNA1 does not provide a detectable advantage to tumor growth in our system. This raises the provocative question of whether it will be possible to develop a therapy that can be applied to all EBV tumors, based on ridding the tumors of the viral episome and therefore the virus, by silencing the BART miRNAs.
It is known that the BART miRNAs are not essential for the in vitro transformation and growth of B cells [42, 43]. This is consistent with our conclusion that the growth enhancement function of the BARTs only applies in vivo. However, deciphering the BART miRNAs responsible for the effect we have observed and the target genes of those miRNAs will be extremely challenging. Our observation that the copy number of all the BART miRNAs increases in vivo for all the tumor types we have studied here and our previous finding that all of the BART miRNAs are highly expressed in biopsies from all types of EBV associated tumors raises the possibility that all of the BART miRNAs may be contributing to tumor growth.
Despite the extensive effort of many laboratories there remain only a few well characterized targets of the BART miRNAs [44]. Of these anti-apoptotic targets predominate however, as stated above we have been unable to confirm previous studies suggesting a role in apoptosis resistance in AGS carcinoma cells in vitro [29]. It is likely that the gene targets of the BART miRNAs are linked to specific in vivo growth functions of both normal and malignant cells. One possible candidate is the difference in geometry between in vivo (3-dimensional) and in vitro (2-dimensional) growth. For example, it is possible that the BART miRNAs regulate signaling pathways that control tumor hypoxia in vivo, which could result in activation of a broad array of mitogenic, pro-invasive and pro-angiogenic genes [45–49]. It is also possible that the growth advantage provided by the miRNAs is a function of the interaction of the tumor cells with the surrounding environment in vivo. For example, the miRNAs may induce the tumor cells to express factors or cell surface changes that elicit growth promoting signals from the surrounding murine milieu in the form of soluble factors such as cytokines and/or recruited cells that potentiate tumor growth.
We have also seen no evidence that the BART miRNAs contribute to invasion or metastasis. Indeed we have observed a trend whereby the miRNAs may actually impede these processes since the rate of metastasis was lower for the BART+ tumors. This result could have arisen because the BART+ tumors grow more rapidly and may kill the mice before the tumors have time to metastasize. However, we also observed that the BART miRNAs have a negative impact on invasion, an important corollary of metastasis. It may simply be that the increased proliferation rate driven by the BART miRNAs marginally diverts the cellular metabolism away from the processes required for invasion and metastasis.
One possible concern with our studies is the high levels of expression we see for the BART miRNAs in tumors. We have previously estimated the BART miRNA copy numbers in biopsy material for the three tumor types studied here [50]. Even taking into account the presence of non-tumor cells in the biopsies and imprecision caused by technical difficulties in recovering the miRNAs from small biopsy samples it is clear that the mouse tumors are expressing the miRNAs at levels at least 10 fold higher than in the biopsies. However, the process driving this up regulation in the mice is physiologic, not for example an artifact of ectopic expression. This would suggest that there may be constraints on the miRNA copy level in the human host that are not imposed in the highly immune incompetent NSG mouse. One question that arises is with respect to the in vivo specificity of the up regulation of the BART miRNAs. Is it conceivable that if we could artificially drive the copy numbers high enough in vitro, we would see an effect on growth? However, in this scenario it is difficult to explain why the copy numbers are reduced again upon culturing the tumors in vitro since any growth advantage due to higher BART copy number should ensure their maintenance. This strongly argues that the selective growth advantage provided by the elevation of the BART miRNAs in vivo is not sustained in vitro.
In summary, therefore, we conclude that the BART miRNAs provide a significant growth advantage to infected tumor cells growing in vivo. This effect may be a combination of growth promoting and survival functions provided by the miRNAs.
Methods
Cell culture
The cell lines used in this study were: NPC line C666–1; BL cell line BL36 (gift of Dr. Jeff Sample); GaCa cell lines AGS and AGS-BX1 (gift of Dr. Lindsey Hutt-Fletcher); AGS cells transfected with oriP//EBNA1 vectors; and mouse tumor-derived explant lines. The GaCa cell lines and GaCa tumor-derived explant lines were cultured in Ham’s F-12 medium containing 10% fetal bovine serum (FBS), 2 mM sodium pyruvate, 2 mM glutamine, and 100 IU of penicillin-streptomycin. All other cells were maintained in RPMI 1640 medium with the same supplements. All adherent lines were passaged after trypsinization.
Lentiviral infection and cell transfection
BL36, C666–1, AGS and AGS-BX1 cells were infected with the pGreenFire1-CMV, TR011VA-1 lentivirus (System Biosciences, Mountain View, CA), which expresses green fluorescent protein (GFP). GFP positive cells were sorted and collected by Fluorescence Activated Cell Sorting (FACS), and were subsequently cultured with appropriate medium. 2×10⁶ luciferase expressing AGS cells were transfected with 5 ug of plasmid DNA from either the oriP/EBNA1-EMPTY (p220) or oriP/EBNA1-BART vector (p3829) (gift of Dr. Bill Sugden) using an Amaxa nucleofector (Lonza), the V kit solution, and Program B-023. After 24 hr, transfected AGS (AGS-EBNA1-EMPTY and AGS-EBNA1-BART) were selected in F12 medium supplemented with 150ug/ml of hygromycin.
Animal and histology studies
Female NOD.Cg-Prkdcscid Il2rgtm1Wjl/SzJ (NSG) mice (the Jackson Lab, ME, USA) ages 6–8 weeks were housed and maintained under sterile conditions with free access to food and water. For carcinoma models, 2.5–7.5×10⁵ cells (C666–1, AGS, AGS-BX1, AGS-EBNA1-EMPTY and AGS-EBNA1-BART) resuspended in 50 ul of phosphate-buffered saline (PBS), were injected with a 25-gauge needle into the nasopharyngeal compartment of NSG mice under anesthesia [30]. For the lymphoma model, 2.5xl05 BL36 cells in 100 ul PBS were injected i.v. via the tail vein into NSG mice. Disease progression was monitored based on overall health and bioluminescent imaging. Mice were intraperitoneally injected with luciferin followed by anesthesia with 3% isoflurane and subsequent measurement of bioluminescence using an IVIS 200 imaging system (Xenogen). Tumor burden (or volume) is presented as the radiance (photons per second per centimeter squared per steradian or p/s/cm2/sr) for each tumor by determining the photon emission/second of a given tumor within a radius encompassing 5% or greater of maximal signal intensity. The Kaplan-Meier survival curve analysis was conducted with the Prism program.
For histology analysis, tissue samples were fixed in 10% formalin buffer and stored in 75% ethanol prior to paraffin wax embedding, sectioning, hematoxylin and eosin (H&E) staining by the Animal Histology Core at Tufts Medical Center.
In vitro tumor explants
A small proportion of tumor tissue was excised at surgical operation and rinsed with DPBS. The tissue was then transferred to a 100mm Petri dish with appropriate medium. For the carcinomas tissue was minced with sterile scalpels into smaller fragment (<2 mm) and pressed under a 3.0 µm PET membrane cell culture insert (BD Biosciences) followed by incubation at 37°C in a 5% CO2-humidified incubator. Carcinoma cells started to grow as a monolayer and attach to the dish in a few days. Occasionally, the dish also contained a few clumps of floating epithelial cells. For lymphoma explant cultures, the tissue was cut and minced into very small pieces in medium. The finely minced tissue in suspension was filtered with a 70 μm cell strainer to remove debris. The cells were pelleted by centrifugation at 1,500 rpm for 5 min and then resuspended in RPMI 1640 medium and grown as usual for suspension cell cultures.
Total RNA and genomic DNA isolation
Tumor tissue was ground to a fine powder in a liquid nitrogen cooled mortar and pestle. For RNA, tissue powder was then extracted using Trizol (Invitrogen) according to the manufacturer’s instructions. For genomic DNA (gDNA), tissue powder was extracted with DNAzol (Invitrogen). Briefly, 1ml of DNAzol was added to the powder and the cell lysates were gently passed through pipettes several times for complete extraction. Insoluble material was removed by centrifugation at 10 000 g for 10 min at 25°C. The viscous supernatant was transferred into another tube and DNA was precipitated using 0.5 ml of 100% ethanol followed by inversion of the tubes several times. The tube was left at room temperature for 20 min and the DNA was pelleted by centrifugation at 14,000 g for 15 min at 4°C. The DNA was washed twice with 1ml 85% ethanol and then air dried. The genomic DNA was finally dissolved in 200 ul 8 mM NaOH and the pH adjusted to 7 by adding 20 uL 1 M HEPES buffer. RNA and DNA were directly purified from cell lines without using a mortar and pestle.
miRNA expression profiling
EBV miRNA expression was measured using real-time multiplex reverse transcript (RT)-PCR [24] and is expressed relative to the ubiquitous small cellular RNA U1. Briefly, a panel of stem-loop RT primers specific for the 3′ end of each mature miRNA was pooled and used for RT of purified RNA with the TaqMan MicroRNA RT kit (Applied Biosystems), followed by TaqMan PCR using specific primers and probes to each miRNA. Calibration curves for estimating the EBV miRNA copy number were generated using serial dilutions of synthetic oligonucleotides for each miRNA. This assay has been used previously for profiling BART miRNA expression in infected human tissue, tumor biopsies and cell lines [22, 24]. Details of the assay including the lower limit of detection (≤10 copies of each miRNA) and linearity of the miRNA qPCR assay (up to ≥108 copies) is described in [24]. For the human miRNAs mir-9, 26a and 34a, the same RT kit and human specific TaqMan MicroRNA assays were used (Life Technologies). The expression of all miRNAs in all experiments was normalized to the ubiquitous, small cell RNA U1.
Quantitative gene and gDNA real-time PCR
mRNAs were measured by real time RT-PCR. A list of the primers used is provided in the supplemental material. RNA was reverse transcribed with an iScript cDNA synthesis kit (Biorad), followed by real-time PCR using IQ SYBR Green supermix (BioRad) and specific primers. EBER1 expression was assessed by TaqMan PCR as previously described. [51] The housekeeping genes GAPDH, actin and tubulin were used as internal control for normalization. Values relative to GAPDH are shown. The relative expression is expressed as 2ΔCt, where ΔCt = mean value Ct (gene of interest) − mean value Ct (GAPDH). For gDNA real time PCR, DNA was diluted 100-fold prior to PCR amplification with the IQ SYBR Green supermix and specific primers. All SYBR Green real time PCRs were performed on a Bio-Rad iCycler. The protocol was as follows: step 1, one cycle of 5 min at 95°C; step 2, 40 cycles of 15 s at 95°C and 1 min at 60°C; step 3, one cycle of 1 min at 95°C. Fluorescence was monitored at the end of each extension phase. After amplification, melting curves were generated to verify the specificity of amplification. Primers for amplification are listed in S3 Table.
Calculation of the oriP/EBNA1 plasmid copy number per cell
To measure the oriP/EBNA1 plasmid copy number per cell in each AGS-EBNA1-EMPTY and AGS-EBNA1-BART tumor sample we divided the plasmid copy number by the number of cells in each sample. To determine how many cells there were, real time qRT-PCR was performed on each sample for the GAPDH mRNA. The Ct values were then converted to cell number from calibration curves (cell number versus RT-PCR signal (Ct)) of serial dilutions of the corresponding cell lines (AGS-EBNA1-EMPTY and AGS-EBNA1-BART).
The determine the total plasmid copy number in the tumor samples we performed gDNA real time PCR for the EBNA1 gene and the Ct values were read from standard curves (Ct versus copy number) generated by using serial 10-fold dilutions of a standard EBV (B95–8) containing suspension with 1.7 × 10⁴ DNA copies/μl (Advanced Biotechnologies).
Growth curve and colony formation assay
For the growth curves, three separate cultures of 3×10⁴ cells were seeded in100 mm Petri dishes. The cell number was then counted in duplicate for each replicate using the Scepter 2.0 handheld automated cell counter (Millipore) at indicated time points. For the soft agar colony formation assays, 1×10⁴ cells were suspended in medium containing 0.4% agarose and overlaid onto a solidified layer of medium-containing 0.8% agarose in 6-well plates. Three separate cultures were set up for each cell line tested. After two-three weeks, colonies were counted and photographed in five fields for each replicate. For each assay 3 independently established BART positive cell lines and 2 independently established BART - lines were tested. The results were expressed as the means ± SEM of the combined data for measurements on all replicates of all the cell lines in a given group.
Apoptosis analysis
For apoptosis sensitivity 4×10⁵ cells were plated onto 6 well plates. Three independent cultures were set up for each cell line. After overnight incubation, cells were treated with 80 uM of etoposide for 72 hr prior to harvest. Harvested cells were washed with Annexin V binding buffer and subsequently stained with Annexin V-APC (BD Bioscience) for 15 min, followed by fixation in 4% buffered paraformaldehyde at room temperature for 5 min. Apoptotic cells were analyzed in duplicate by flow cytometry and defined as positive for Annexin V-APC staining. The percentage of cells that had undergone apoptosis in response to etoposide was assessed by subtracting that of apoptotic cells in the untreated from the treated population (%Delta Annexin-V+).
Matrigel invasion assays
In vitro invasion assays were carried out as described previously [52] using complete Matrigel (BD Biosciences). A total of 18 μg Matrigel at a concentration of 0.3 μg/μl was coated onto a FluoroBlok insert (BD Biosciences) with an 8 μm pore size membrane. The transwell insert was allowed to dry overnight at room temperature and rehydrated with 60 ul of serum-free Ham’s F-12 medium for 2 hr. Cells were seeded in triplicate at 5×10⁴ per transwell insert. 500 μl of media containing 5% FBS were added to the lower well of the assay chamber to act as a chemoattractant. After 24 hr, the transwell inserts were placed onto wells containing 4 μg/ml calcein AM in Hanks’ balanced salt solution and incubated for 30 min at 37°C in 5% CO2. Cells that had passed through the pores and reached the trans-side of the membrane were counted with the imaging software MetaXpress. The number of invading cells was averaged over triplicate wells and presented as the means ± SD.
Ethics statement
All animal experiments described in this study were performed according to the Guidelines of the Tufts University Division of Laboratory Animal Medicine and were in accordance with the National Institutes of Health guide for the Care and Use of Laboratory Animals. Animal protocols were approved by the Tufts University Institutional Animal Care and Use Committee (protocol B2011–108).
Supporting Information
Zdroje
1. Kieff E, Rickinson A (2007) Epstein-Barr Virus. In: Fields’ virology. Knipe DM, Howley PM, editors. Philadelphia: Wolters kluwer/Lippincott Williams & Wilkins.
2. Thorley-Lawson DA, Babcock GJ (1999) A model for persistent infection with Epstein-Barr virus: the stealth virus of human B cells. Life sciences 65 : 1433–1453. doi: 10.1016/S0024-3205(99)00214-3 10530796
3. Babcock GJ, Thorley-Lawson DA (2000) Tonsillar memory B cells, latently infected with Epstein-Barr virus, express the restricted pattern of latent genes previously found only in Epstein-Barr virus-associated tumors. Proceedings of the National Academy of Sciences of the United States of America 97 : 12250–12255. doi: 10.1073/pnas.200366597 11035774
4. Thorley-Lawson DA, Gross A (2004) Persistence of the Epstein-Barr virus and the origins of associated lymphomas. The New England journal of medicine 350 : 1328–1337. doi: 10.1056/NEJMra032015 15044644
5. Gregory CD, Rowe M, Rickinson AB (1990) Different Epstein-Barr virus-B cell interactions in phenotypically distinct clones of a Burkitt’s lymphoma cell line. The Journal of general virology 71 (Pt 7): 1481–1495. doi: 10.1099/0022-1317-71-7-1481 2165133
6. Rowe M, Rowe DT, Gregory CD, Young LS, Farrell PJ, et al. (1987) Differences in B cell growth phenotype reflect novel patterns of Epstein-Barr virus latent gene expression in Burkitt’s lymphoma cells. The EMBO journal 6 : 2743–2751. 2824192
7. Hochberg D, Middeldorp JM, Catalina M, Sullivan JL, Luzuriaga K, et al. (2004) Demonstration of the Burkitt’s lymphoma Epstein-Barr virus phenotype in dividing latently infected memory cells in vivo. Proceedings of the National Academy of Sciences of the United States of America 101 : 239–244. doi: 10.1073/pnas.2237267100 14688409
8. Kirchmaier AL, Sugden B (1995) Plasmid maintenance of derivatives of oriP of Epstein-Barr virus. J Virol 69 : 1280–1283. 7815506
9. Leight ER, Sugden B (2001) Establishment of an oriP replicon is dependent upon an infrequent, epigenetic event. Molecular and cellular biology 21 : 4149–4161. doi: 10.1128/MCB.21.13.4149-4161.2001 11390644
10. Middleton T, Sugden B (1994) Retention of plasmid DNA in mammalian cells is enhanced by binding of the Epstein-Barr virus replication protein EBNA1. Journal of virology 68 : 4067–4071. 8189545
11. Yates JL, Warren N, Sugden B (1985) Stable replication of plasmids derived from Epstein-Barr virus in various mammalian cells. Nature 313 : 812–815. doi: 10.1038/313812a0 2983224
12. Chodosh J, Holder VP, Gan YJ, Belgaumi A, Sample J, et al. (1998) Eradication of latent Epstein-Barr virus by hydroxyurea alters the growth-transformed cell phenotype. The Journal of infectious diseases 177 : 1194–1201. doi: 10.1086/515290 9593003
13. Hammerschmidt W, Sugden B (2004) Epstein-Barr virus sustains Burkitt’s lymphomas and Hodgkin’s disease. Trends Mol Med 10 : 331–336. doi: 10.1016/j.molmed.2004.05.006 15242681
14. Kennedy G, Komano J, Sugden B (2003) Epstein-Barr virus provides a survival factor to Burkitt’s lymphomas. Proc Natl Acad Sci U S A 100 : 14269–14274. doi: 10.1073/pnas.2336099100 14603034
15. Komano J, Sugiura M, Takada K (1998) Epstein-Barr virus contributes to the malignant phenotype and to apoptosis resistance in Burkitt’s lymphoma cell line Akata. Journal of virology 72 : 9150–9156. 9765461
16. Shimizu N, Tanabe-Tochikura A, Kuroiwa Y, Takada K (1994) Isolation of Epstein-Barr virus (EBV)-negative cell clones from the EBV-positive Burkitt’s lymphoma (BL) line Akata: malignant phenotypes of BL cells are dependent on EBV. Journal of virology 68 : 6069–6073. 8057484
17. Vereide D, Sugden B (2009) Proof for EBV’s sustaining role in Burkitt’s lymphomas. Semin Cancer Biol 19 : 389–393. doi: 10.1016/j.semcancer.2009.07.006 19628040
18. Cai X, Schafer A, Lu S, Bilello JP, Desrosiers RC, et al. (2006) Epstein-Barr virus microRNAs are evolutionarily conserved and differentially expressed. PLoS pathogens 2: e23. doi: 10.1371/journal.ppat.0020023 16557291
19. Chen SJ, Chen GH, Chen YH, Liu CY, Chang KP, et al. (2010) Characterization of Epstein-Barr virus miRNAome in nasopharyngeal carcinoma by deep sequencing. PloS one 5.
20. Grundhoff A, Sullivan CS, Ganem D (2006) A combined computational and microarray-based approach identifies novel microRNAs encoded by human gamma-herpesviruses. RNA 12 : 733–750. doi: 10.1261/rna.2326106 16540699
21. Pfeffer S, Zavolan M, Grasser FA, Chien M, Russo JJ, et al. (2004) Identification of virus-encoded microRNAs. Science 304 : 734–736. doi: 10.1126/science.1096781 15118162
22. Qiu J, Cosmopoulos K, Pegtel M, Hopmans E, Murray P, et al. (2011) A novel persistence associated EBV miRNA expression profile is disrupted in neoplasia. PLoS pathogens 7: e1002193. doi: 10.1371/journal.ppat.1002193 21901094
23. Zhu JY, Pfuhl T, Motsch N, Barth S, Nicholls J, et al. (2009) Identification of novel Epstein-Barr virus microRNA genes from nasopharyngeal carcinomas. Journal of virology 83 : 3333–3341. doi: 10.1128/JVI.01689-08 19144710
24. Cosmopoulos K, Pegtel M, Hawkins J, Moffett H, Novina C, et al. (2009) Comprehensive profiling of Epstein-Barr virus microRNAs in nasopharyngeal carcinoma. Journal of virology 83 : 2357–2367. doi: 10.1128/JVI.02104-08 19091858
25. Vereide DT, Seto E, Chiu YF, Hayes M, Tagawa T, et al. (2013) Epstein-Barr virus maintains lymphomas via its miRNAs. Oncogene.
26. Choy EY, Siu KL, Kok KH, Lung RW, Tsang CM, et al. (2008) An Epstein-Barr virus-encoded microRNA targets PUMA to promote host cell survival. The Journal of experimental medicine 205 : 2551–2560. doi: 10.1084/jem.20072581 18838543
27. Riley KJ, Rabinowitz GS, Yario TA, Luna JM, Darnell RB, et al. (2012) EBV and human microRNAs co-target oncogenic and apoptotic viral and human genes during latency. The EMBO journal 31 : 2207–2221. doi: 10.1038/emboj.2012.63 22473208
28. Lei T, Yuen KS, Xu R, Tsao SW, Chen H, et al. (2013) Targeting of DICE1 tumor suppressor by Epstein-Barr virus-encoded miR-BART3* microRNA in nasopharyngeal carcinoma. International journal of cancer Journal international du cancer 133 : 79–87. doi: 10.1002/ijc.28007 23280823
29. Marquitz AR, Mathur A, Nam CS, Raab-Traub N (2011) The Epstein-Barr Virus BART microRNAs target the pro-apoptotic protein Bim. Virology 412 : 392–400. doi: 10.1016/j.virol.2011.01.028 21333317
30. Smith PA, Merritt D, Barr L, Thorley-Lawson DA (2011) An orthotopic model of metastatic nasopharyngeal carcinoma and its application in elucidating a therapeutic target that inhibits metastasis. Genes & cancer 2 : 1023–1033. doi: 10.1177/1947601912440878 22737268
31. Kudo-Saito C, Shirako H, Takeuchi T, Kawakami Y (2009) Cancer metastasis is accelerated through immunosuppression during Snail-induced EMT of cancer cells. Cancer Cell 15 : 195–206. doi: 10.1016/j.ccr.2009.01.023 19249678
32. de Herreros AG, Peiro S, Nassour M, Savagner P (2010) Snail family regulation and epithelial mesenchymal transitions in breast cancer progression. J Mammary Gland Biol Neoplasia 15 : 135–147. doi: 10.1007/s10911-010-9179-8 20455012
33. Wang Y, Shi J, Chai K, Ying X, Zhou BP (2013) The Role of Snail in EMT and Tumorigenesis. Curr Cancer Drug Targets 13 : 963–972. doi: 10.2174/15680096113136660102 24168186
34. Yates JL, Guan N (1991) Epstein-Barr virus-derived plasmids replicate only once per cell cycle and are not amplified after entry into cells. Journal of virology 65 : 483–488. 1845903
35. Cuomo L, Ramquist T, Trivedi P, Wang F, Klein G, et al. (1992) Expression of the Epstein-Barr virus (EBV)-encoded membrane protein LMP1 impairs the in vitro growth, clonability and tumorigenicity of an EBV-negative Burkitt lymphoma line. International journal of cancer Journal international du cancer 51 : 949–955. doi: 10.1002/ijc.2910510619 1322379
36. Walter J, Moller P, Moldenhauer G, Schirrmacher V, Pawlita M, et al. (1992) Local growth of a Burkitt’s lymphoma versus disseminated invasive growth of the autologous EBV-immortalized lymphoblastoid cells and their somatic cell hybrids in SCID mice. International journal of cancer Journal international du cancer 50 : 265–273. doi: 10.1002/ijc.2910500217 1309726
37. Man CH, Wei-Man Lun S, Wai-Ying Hui J, To KF, Choy KW, et al. (2012) Inhibition of NOTCH3 signalling significantly enhances sensitivity to cisplatin in EBV-associated nasopharyngeal carcinoma. The Journal of pathology 226 : 471–481. doi: 10.1002/path.2997 22009689
38. Angiolillo AL, Sgadari C, Sheikh N, Reaman GH, Tosato G (1995) Regression of experimental human leukemias and solid tumors induced by Epstein-Barr virus-immortalized B cells. Leukemia & lymphoma 19 : 267–276. doi: 10.3109/10428199509107897 8535218
39. Ghetie MA, Richardson J, Tucker T, Jones D, Uhr JW, et al. (1990) Disseminated or localized growth of a human B-cell tumor (Daudi) in SCID mice. International journal of cancer Journal international du cancer 45 : 481–485. doi: 10.1002/ijc.2910450318 2307538
40. Zhang C, Awasthi N, Schwarz MA, Schwarz RE (2013) Establishing a peritoneal dissemination xenograft mouse model for survival outcome assessment of experimental gastric cancer. The Journal of surgical research 182 : 227–234. doi: 10.1016/j.jss.2012.10.052 23201270
41. von Kalle C, Wolf J, Becker A, Sckaer A, Munck M, et al. (1992) Growth of Hodgkin cell lines in severely combined immunodeficient mice. International journal of cancer Journal international du cancer 52 : 887–891. doi: 10.1002/ijc.2910520610 1459730
42. Robertson ES, Tomkinson B, Kieff E (1994) An Epstein-Barr virus with a 58-kilobase-pair deletion that includes BARF0 transforms B lymphocytes in vitro. Journal of virology 68 : 1449–1458. 8107208
43. Kempkes B, Pich D, Zeidler R, Sugden B, Hammerschmidt W (1995) Immortalization of human B lymphocytes by a plasmid containing 71 kilobase pairs of Epstein-Barr virus DNA. Journal of virology 69 : 231–238. 7983714
44. Klinke O, Feederle R, Delecluse HJ (2014) Genetics of Epstein-Barr virus microRNAs. Semin Cancer Biol 26C: 52–59. doi: 10.1016/j.semcancer.2014.02.002 24602823
45. Darekar S, Georgiou K, Yurchenko M, Yenamandra SP, Chachami G, et al. (2012) Epstein-Barr virus immortalization of human B-cells leads to stabilization of hypoxia-induced factor 1 alpha, congruent with the Warburg effect. PLoS One 7: e42072. doi: 10.1371/journal.pone.0042072 22848707
46. Murono S, Inoue H, Tanabe T, Joab I, Yoshizaki T, et al. (2001) Induction of cyclooxygenase-2 by Epstein-Barr virus latent membrane protein 1 is involved in vascular endothelial growth factor production in nasopharyngeal carcinoma cells. Proc Natl Acad Sci U S A 98 : 6905–6910. doi: 10.1073/pnas.121016998 11381123
47. Sakakibara S, Tosato G (2009) Regulation of angiogenesis in malignancies associated with Epstein-Barr virus and Kaposi’s sarcoma-associated herpes virus. Future Microbiol 4 : 903–917. doi: 10.2217/fmb.09.49 19722843
48. Wakisaka N, Kondo S, Yoshizaki T, Murono S, Furukawa M, et al. (2004) Epstein-Barr virus latent membrane protein 1 induces synthesis of hypoxia-inducible factor 1 alpha. Mol Cell Biol 24 : 5223–5234. doi: 10.1128/MCB.24.12.5223-5234.2004 15169887
49. Wakisaka N, Murono S, Yoshizaki T, Furukawa M, Pagano JS (2002) Epstein-barr virus latent membrane protein 1 induces and causes release of fibroblast growth factor-2. Cancer Res 62 : 6337–6344. 12414666
50. Qiu J, Cosmopoulos K, Pegtel M, Hopmans E, Murray P, et al. (2011) A novel persistence associated EBV miRNA expression profile is disrupted in neoplasia. PLoS Pathog 7: e1002193. doi: 10.1371/journal.ppat.1002193 21901094
51. Hochberg D, Souza T, Catalina M, Sullivan JL, Luzuriaga K, et al. (2004) Acute infection with Epstein-Barr virus targets and overwhelms the peripheral memory B-cell compartment with resting, latently infected cells. J Virol 78 : 5194–5204. doi: 10.1128/JVI.78.10.5194-5204.2004 15113901
52. Partridge J, Flaherty P (2009) An in vitro FluoroBlok tumor invasion assay. Journal of visualized experiments: JoVE. doi: 10.3791/1475 19620957
Štítky
Hygiena a epidemiológia Infekčné lekárstvo LaboratóriumČlánok vyšiel v časopise
PLOS Pathogens
2015 Číslo 1
- Parazitičtí červi v terapii Crohnovy choroby a dalších zánětlivých autoimunitních onemocnění
- Očkování proti virové hemoragické horečce Ebola experimentální vakcínou rVSVDG-ZEBOV-GP
- Koronavirus hýbe světem: Víte jak se chránit a jak postupovat v případě podezření?
Najčítanejšie v tomto čísle
- Infections in Humans and Animals: Pathophysiology, Detection, and Treatment
- : Trypanosomatids Adapted to Plant Environments
- Environmental Drivers of the Spatiotemporal Dynamics of Respiratory Syncytial Virus in the United States
- Dengue Virus RNA Structure Specialization Facilitates Host Adaptation