
Genetically Predicted Body Mass Index and Breast Cancer Risk: Mendelian Randomization Analyses of Data from 145,000 Women of European Descent
Using Mendelian randomization analysis, Wei Zheng and colleagues probe potentially causal associations between BMI and breast cancer risk in both pre - and postmenopausal women.
Published in the journal:
Genetically Predicted Body Mass Index and Breast Cancer Risk: Mendelian Randomization Analyses of Data from 145,000 Women of European Descent. PLoS Med 13(8): e32767. doi:10.1371/journal.pmed.1002105
Category:
Research Article
doi:
https://doi.org/10.1371/journal.pmed.1002105
Summary
Using Mendelian randomization analysis, Wei Zheng and colleagues probe potentially causal associations between BMI and breast cancer risk in both pre - and postmenopausal women.
Introduction
The association between body mass index (BMI) and breast cancer risk has been extensively investigated in observational epidemiologic studies. Most prospective cohort studies reported an inverse association between BMI and premenopausal breast cancer risk [1–7]. A modest positive association has been reported between BMI and postmenopausal breast cancer risk [1,3,8], and this association was primarily limited to women who did not use postmenopausal hormone therapy (HT) [2,9,10] or women diagnosed with estrogen receptor (ER)-positive breast cancer [10].
Several explanations have been proposed for the opposite direction of the association between BMI and breast cancer risk by menopausal status. For example, it is postulated that overweight and obese women are more likely to experience anovulatory menstrual cycles, potentially leading to lower exposure to ovarian hormones and thus reducing the risk of breast cancer in premenopausal women [11,12]. Among postmenopausal women, the primary source of estrogen is the conversion of androgens in adipose tissue. Overweight women have been found to have higher estrogen levels than normal weight women, providing a possible explanation for positive associations observed between BMI and breast cancer risk in postmenopausal women. Although these postulated explanations are biologically plausible for the different associations observed between measured BMI and breast cancer risk in pre-and postmenopausal women, it remains unclear whether BMI is causally associated with breast cancer risk or serves as a surrogate measure for other risk factors. These uncertainties should be clearly communicated in public health messages about breast cancer prevention.
Recent genome-wide association studies (GWAS) have identified multiple loci associated with BMI. A genetic score, comprising BMI-associated single nucleotide polymorphisms (SNPs) capturing the portion of BMI determined by genetic factors, can be used in Mendelian randomization (MR) as the instrumental variable to evaluate the association between BMI and breast cancer risk by eliminating concerns of reverse causation and reducing the likelihood of selection bias and confounding in conventional epidemiologic studies. This is because the alleles associated with BMI should be randomly assigned to offspring from parents during gamete formation. In this study, data from two large consortia were used to conduct a MR analysis to assess the association between BMI and breast cancer risk.
Methods
Study Population: BCAC and DRIVE Consortia
We obtained data from two large consortia, the Breast Cancer Association Consortium (BCAC) and the Discovery, Biology, and Risk of Inherited Variants in Breast Cancer (DRIVE) Project. All participating studies obtained written, informed consent from all subjects and received study protocol approval from their respective Institutional Review Boards. Our first analysis included 39 studies contributing participants of European ancestry to the BCAC Collaborative Oncological Gene Environment Study (COGS) project (S1 Table). This analysis included data from 46,235 breast cancer cases and 42,482 controls. Selected characteristics of BCAC participants by study are provided in S2 Table. Details of the genotyping protocol in the BCAC are described elsewhere [13] (http://ccge.medschl.cam.ac.uk/research/consortia/icogs/). Genotype data were obtained either by direct genotyping using a custom Illumina iSelect genotyping array (iCOGS) that contains 211,155 SNPs [13] or by imputation, using data from the iCOGS array and the 1000 Genomes Project Phase I integrated variant set (March 2012 release) as the reference using the program IMPUTE2 [14]. Population-specific variations in allele frequencies of the SNPs were accounted for by eight principal components using a set of 37,000 uncorrelated SNPs, including those selected as ancestry-informative markers, as previously described [13].
To further assess the association between genetically predicted BMI and breast cancer risk, we analyzed data from the DRIVE project, for which summary-level statistics from 16,003 breast cancer cases and 41,335 controls of European ancestry from 11 participating studies were available (S3 Table). DRIVE project genotyping data were generated by Illumina and Affymetrix SNP genotyping arrays or by genotype imputation with the HapMap phase 2 CEU panel as reference using MACH v1.0 [15] or IMPUTE [14].
Selection of BMI-Associated SNPs
SNPs associated with variation in BMI were identified from the NHGRI-EBI Catalog of Published Genome-Wide Association Studies in August 2015 [16]. Furthermore, we included all BMI-associated SNPs from the latest finding of Genetic Investigation of Anthropometric Traits (GIANT) [17]. SNPs associated with BMI at genome-wide significance levels (p < 5 × 10⁻⁸) in populations of European ancestry were selected for this study. We selected independent SNPs, defined as r2 < 0.1 based on International HapMap Project phase 3 data. For any two SNPs with an r2 ≥ 0.1, the SNP with the lower p-value for association with BMI was selected. In total, 84 SNPs were selected for analysis. In BCAC data, 50 of the 84 SNPs were successfully genotyped, and the remaining 34 SNPs were imputed with high quality (imputation r2 > 0.8).
Statistical Analysis
Genetic scores for BMI (BMI-GS) used for MR were computed using previously described methods [18–22]. The GS used in our primary analysis was constructed using external weights, and calculated using the following formula: GS=∑i=184βiSNPi, where βi is the effect of the ith SNP for BMI reported in previous studies [17] and SNPi is the dosage of the effect allele (range: 0 to 2) of the ith SNP. To scale the GS to the unit of BMI, we first performed a linear regression among controls, observed BMI ~ GS + error, where the expectation of error is zero. From this regression we obtained β0 (slope = 18.99) and β1 (effect = 0.451). Then, we used the values of β0 and β1 to compute BMI-GS using the formula, BMI-GS = β0 + β1 * GS. The BMI-GS is a linear transformation of GS, and thus, these two variables were perfectly correlated (r = 1.0).
Pooled analyses and meta-analysis were conducted to evaluate the association of BMI-GS with breast cancer risk. In pooled analysis, subjects from all BCAC studies were analyzed with adjustment for the BCAC study sites. In meta-analysis, we estimated the risk of breast cancer associated with BMI-GS in each of the BCAC studies, and then combined the results using a fixed effects model. Sensitivity analyses were performed using an unweighted BMI-GS to evaluate the robustness of the association (S4 Table). The percentage of BMI variation explained by BMI-GS was calculated using linear regression models. We performed Egger regression [23] analysis to detect possible pleiotropic effects of the instrumental variable used in our analyses.
Logistic regression was used to calculate adjusted odds ratios for the association between BMI-GS (continuously and categorically: 25.5–25.9, 26.0–26.5, and ≥26.5 kg/m2), versus <25.5. Traditional World Health Organization BMI cutoffs were not used because of the narrow range of the BMI predicted by BMI-GSs (range: 24.14–28.53).
We performed stratified analyses by factors that could potentially modify the association, including age, menopausal status, and postmenopausal HT. We assessed heterogeneity by hormone receptor status. Potential confounders included in logistic regression models were BCAC study site, age, and the eight principal components as described previously [13]. In some analyses, we also adjusted for known and suspected breast cancer risk factors, including age at menarche, HT use, and smoking. We used the two-sample method [24] to analyze the association of BMI-GS and breast cancer risk using the summary statistics data obtained from the DRIVE project (available on the Genetic Associations and Mechanisms in Oncology [GAME-ON] website: http://gameon.dfci.harvard.edu). The potential causal association between BMI (X) and breast cancer risk (Y) was modeled using BMI-associated SNPs as the instrumental variable [25]. Specifically, the causal effect (βYX) was calculated by using the Wald estimator: βYX=βYGβXG, where βYG is the natural log-scale odds ratio (OR) for breast cancer risk associated with the instrumental variable; βXG is the regression coefficient of the instrumental variable for BMI obtained from previous GWAS [17]. The standard error for the causal effect was computed using the delta method [26]: SEYX=((SYGβXG)2+(SXGβYG)2βXG4); SYG and SXG are the corresponding standard errors. We used an inverse-variance weighted method [27] to evaluate the combined association of the 84 BMI-associated SNPs with breast cancer risk.
To evaluate the associations between individual SNPs and breast cancer risk, summary estimates from the BCAC and DRIVE datasets were combined using the inverse-variance weighted method [28]. Analyses were performed using PLINK (v 1.07), R (v 3.02), and SAS (v 9.3). A two-sided p-value < 0.05 was considered statistically significant unless stated otherwise.
Results
In pooled analyses including BCAC controls, the point estimates for the associations between all 84 SNPs and BMI were in the same direction as reported in the literature. However, only 39 of the 84 SNPs showed associations with BMI at p ≤ 0.05, likely because of small sample size (S5 Table).
As expected, we observed a positive association between BMI-GS and observed BMI in pooled analyses using data from controls (p < 0.001 for premenopausal women, p < 0.001for postmenopausal women, and p < 0.001for all controls combined) (Table 1). Using data from cases and controls combined, we showed associations of BMI-GS with age at menarche (p < 0.001), postmenopausal HT use (p = 0.004), smoking (p < 0.001), and weight (p < 0.001). Results were unchanged after adjusting for observed BMI (S6 Table).

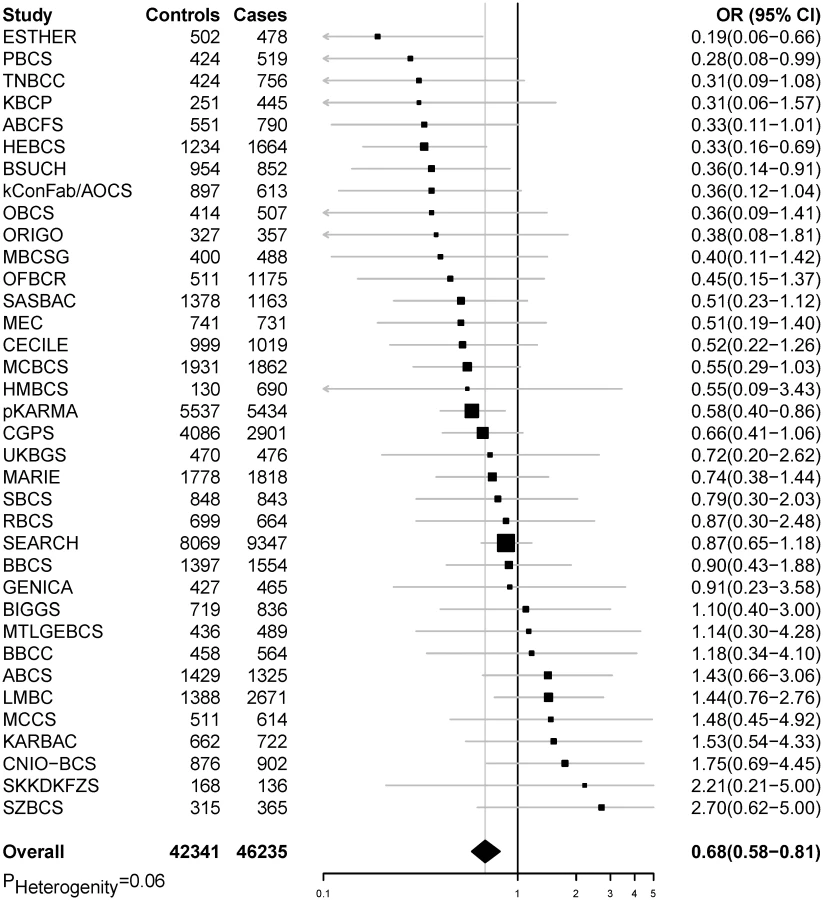
In pooled analyses of BCAC data, an inverse association was observed between breast cancer risk and genetically predicted BMI (Table 2). The OR per 5 kg/m2 increase in BMI using meta-analyses was 0.65 (95% CI: 0.56–0.75, p < 3.32×10⁻¹⁰), which was similar to that derived from the pooled analyses, OR = 0.68 (95% CI: 0.58–0.81, p < 2.50 × 10⁻⁵). There was no apparent evidence for heterogeneity in the OR among BCAC studies (heterogeneity p = 0.06) (Fig 1). MR-Egger regression testing on funnel plot asymmetry yielded p = 0.44, suggesting no violation of the basic assumptions for MR (S1 Fig). In pooled analysis, adjusting for observed BMI did not change the results (OR = 0.57, 95% CI: 0.45–0.70, p = 8.17×10⁻⁹). As a part of the sensitivity analysis, we also performed pooled analysis adjusting for breast cancer risk factors as covariables. As expected, adjustment of these variables slightly attenuated the association. However, the association remained highly statistically significant (Fig 2). The OR for the association between genetically predicted BMI and breast cancer risk was similar for pre - and postmenopausal women (heterogeneity test, p = 0.45), and in postmenopausal women, it was similar for women with and without use of HT (heterogeneity test, p = 0.42). There was some evidence for a stronger association for ER-positive tumors than ER-negative tumors (heterogeneity test, ER p = 0.03). Associations were similar in population-based studies (OR = 0.52, 95% CI: 0.38–0.70, p = 1.84×10⁻⁶) and non-population-based studies (OR = 0.71, 95% CI: 0.54–0.92, p = 0.007). Analyses using categorical variables of genetically predicted BMI showed inverse results similar to analyses treating predicted BMI as a continuous variable. We also stratified subjects by age (<50 y, 50–55 y, 55–65 y, >65 y) and found an inverse association between genetically predicted BMI and breast cancer risk for all age groups ≤ 65 y (S7 Table). No association between predicted BMI and breast cancer was observed in the age group > 65 (OR = 0.85, 95% CI: 0.62–1.15, p = 0.29). The BMI predicted using unweighted GS was also associated with reduced breast cancer risk (Fig 2). The effect sizes were similar, but somewhat weaker for unweighted analyses. The BMI-GS explained 1.23% of variation in BMI in the BCAC control group. Analyses of summary statistics from the DRIVE project replicated the inverse association between genetically predicted BMI and breast cancer risk, OR = 0.72 (95% CI: 0.60–0.84, p = 1.64×10⁻⁷) (S8 Table). The strength of the association observed was similar to that observed in the BCAC dataset.


In pooled analysis of the BCAC data, 15 of the 84 SNPs analyzed in the study showed an inverse association with breast cancer risk, and one showed positive association with breast cancer risk at p < 0.05 (S9 and S10 Tables). In the DRIVE dataset, 12 of the 84 SNP were significantly inversely associated with breast cancer risk, including 9 SNPs that were also significant in the BCAC data (S8 and S10 Tables). When the datasets were combined, 17 SNPs showed an association with breast cancer risk at p < 0.05, and 16 of them showed an inverse association (Table 3 and S10 Table). Five of the associations remained statistically significant after adjusting for multiple comparisons (p < 0.0006 for 84 comparisons).

Using data from BCAC, we conducted pooled analyses to evaluate the association of observed BMI with breast cancer risk by study design. Data from prospective cohort studies showed a positive association between observed BMI and breast cancer risk among postmenopausal women, while an inverse association was seen among premenopausal women (S11 Table). Data from nonprospective studies, however, showed an inverse association for both pre - and postmenopausal women. Additional adjustment for BMI-GS did not alter the association between observed BMI and breast cancer risk.
Discussion
Utilizing data from two large consortia, we found in this large MR study a consistent inverse association between BMI predicted by GWAS-identified genetic variants and premenopausal breast cancer risk in all subgroups examined, which is qualitatively consistent with the majority of published epidemiologic studies using measured BMI, although our predicted association, a 46% reduction in risk per 5 kg/m2 increase in BMI, is larger than that estimated in observational studies using measured BMI [1,3,5,8,29]. Prominent hypotheses regarding the underlying cause of the association between higher BMI and decreased premenopausal breast cancer risk implicate more frequent anovulation, lower endogenous estrogen levels, and fewer breast cell divisions in obese women as compared to leaner women.
Our MR analyses demonstrate an inverse association between genetically predicted BMI and postmenopausal breast cancer risk, with a predicted effect similar to that seen in premenopausal women. In contrast, previous large observational studies indicate a 5%–15% increased risk for postmenopausal breast cancer per 5 kg/m2 increase in BMI [1,8]. In our analysis of prospective cohort studies included in BCAC, we observed a similar increase in breast cancer risk associated with observed BMI among postmenopausal women. However, this positive association was not found in the analysis of data from case-control studies included in BCAC, perhaps due to reverse causation. Because disease diagnosis and progress could change body weight, BMI measured after cancer diagnosis, which is done in most case-control studies, does not reflect usual or long-term BMI, and case-control studies are biased in evaluating the association of BMI and cancer risk. Because no BMI data from cases were used in our MR analyses, we have effectively overcome the possible influence of reverse causation in our study results from MR analyses.
The finding for an inverse association between BMI predicted using GWAS-identified SNPs and postmenopausal breast cancer risk differs from findings reported previously in studies using measured BMI, revealing a complex relationship of genetic determinants of BMI, weight gain, and breast cancer risk. A recent study found that a BMI-GS composed of 31 GWAS-identified SNPs (the majority of which are included in our study) was positively associated with annual weight gain between age 20 y and the time of the study baseline interview when participants were middle-aged [30]. On the other hand, this GS was related to a reduced weight in later adulthood. These results suggest that the genetic portion of BMI, as measured using the BMI-GS in our study, may reflect an early-life BMI.
Several studies found that early-life BMI was inversely associated with breast cancer risk, and this inverse association is consistent in premenopausal [31,32] and postmenopausal [31,33] women. It is possible that weight gain during later adulthood, not adult BMI per se, is related to increased postmenopausal breast cancer risk among overweight women as determined using measured BMI. However, we were unable to directly evaluate this hypothesis in our study because adult weight change was not consistently measured in the BCAC contributing studies. Furthermore, the SNPs used to construct the BMI-GS were identified from genetic association studies that included mostly middle-aged adults, and thus, they may not be able to measure weight gain in later adulthood adequately.
After menopause, the primary source of estrogen is formed in adipose tissue, [11,34] causing overweight and obese postmenopausal women to have higher circulating overall and free estradiol levels than their normal BMI counterparts. In premenopausal women, a high BMI is related to anovulatory menstrual cycles. Women with high BMI in both pre - and postmenopause may have lower lifetime estrogen exposure (and thus lower risk of breast cancer) than those who gain weight primarily after menopause. Additionally, measured BMI in postmenopausal women may be a surrogate breast cancer risk factor for adiposity-related changes occurring near or after menopause, such as age-associated slowing metabolism and inflammation associated with increased abdominal fat [35]. Previous investigations support the theory that adult weight gain is positively associated with postmenopausal breast cancer risk, and some investigators have suggested that weight gain may be a more important risk factor for postmenopausal woman than postmenopausal BMI [36,37]. Future research will be necessary to determine the potentially complicated causal mechanisms underlying the association between BMI and breast cancer risk for postmenopausal women.
In our study, we observed associations of high BMI-GS with early age at menarche, low prevalence of postmenopausal HT use, and high prevalence of cigarette smoking. It is known that high body weight is associated with an early age at menarche [38], and overweight women are more likely to smoke cigarettes regularly to reduce or maintain body weight [39,40]. Overweight women are less likely to use HT [41] (likely because their endogenous estrogen levels are higher than normal/underweight women, and thus, they are less likely to experience postmenopausal symptoms—the major reason for HT use). Therefore, it is most likely that the association of these variables with the BMI-GS is mediated through BMI, indicating that the association of the BMI-GS with these breast cancer risk factors does not violate the assumption of MR analyses in our study. Indeed, analyses without adjusting for these variables revealed a stronger association of BMI-GS with breast cancer risk than those with adjustments of these variables. Some of the BMI-associated variants may be associated with certain functions in the central nervous system [17], and these functions in turn are associated with BMI and perhaps other behaviors currently unknown to us. It is also possible that some of the BMI-associated SNPs may be related to other traits. However, we were unable to evaluate these hypotheses in our study. It would be interesting to further evaluate possible pleiotropic effects of BMI-GS in future large MR analyses with extensively measured environmental factors.
We evaluated whether postmenopausal HT use may modify the association between BMI-GS and breast cancer risk or whether the association may vary by tumor hormone receptor status. Unlike some conventional observational studies on observed BMI-postmenopausal breast cancer association [9,42], we did not find the association for BMI-GS to be modified by HT use. We found that the association between the BMI-GS and breast cancer risk was consistent across hormone receptor subtypes. Although ER-positive and ER-negative breast cancer are heterogeneous clinically, they do have a number of shared risk factors, such as age at menarche, benign breast disease, and family history [43].
Our study has certain limitations. To date, GWAS-identified SNPs represent a small, but statistically significant, portion of the explained variance of observed BMI—approximately 2.7% [17,44,45]. Nevertheless, the instrumental variable created in our study is sufficiently strong for conducting MR analyses [46]. Only summary statistics data were available from the DRIVE project, and thus, we were unable to perform analyses stratified by menopausal status and hormone receptor status. However, most of the subjects included in the DRIVE project were postmenopausal women, and the strength of the association between BMI-GS and breast cancer observed in BCAC and DRIVE consortia was similar.
Using data from approximately 146,000 women involved in two large consortia, we provide strong evidence of an inverse association between genetically predicted BMI and breast cancer risk for both premenopausal and postmenopausal women. The present study adds to the body of knowledge on the influence of body mass on breast cancer risk and points to further work required to elucidate the mechanisms responsible for the complex relationship between BMI and breast cancer risk. Our study, along with recent findings of an association of BMI-GS with weight gain in early adult life but weight loss in late adult life, suggests that weight gain later in adulthood may explain, at least partially, the positive association reported from previous studies between measured adult BMI and postmenopausal breast cancer risk, providing further support for lifestyle modification to reduce obesity as the primary prevention of breast cancer.
Supporting Information
Zdroje
1. Renehan AG, Tyson M, Egger M, Heller RF, Zwahlen M. Body-mass index and incidence of cancer: a systematic review and meta-analysis of prospective observational studies. Lancet. 2008;371(9612):569–78. doi: 10.1016/S0140-6736(08)60269-X 18280327.
2. Huang Z, Hankinson SE, Colditz GA, Stampfer MJ, Hunter DJ, Manson JE, et al. Dual effects of weight and weight gain on breast cancer risk. JAMA. 1997;278(17):1407–11. Epub 1997/11/14. 9355998.
3. van den Brandt PA, Spiegelman D, Yaun SS, Adami HO, Beeson L, Folsom AR, et al. Pooled analysis of prospective cohort studies on height, weight, and breast cancer risk. Am J Epidemiol. 2000;152(6):514–27. Epub 2000/09/21. 10997541.
4. Vatten LJ, Kvinnsland S. Prospective study of height, body mass index and risk of breast cancer. Acta Oncol. 1992;31(2):195–200. Epub 1992/01/01. 1622634.
5. Ursin G, Longnecker MP, Haile RW, Greenland S. A meta-analysis of body mass index and risk of premenopausal breast cancer. Epidemiology. 1995;6(2):137–41. Epub 1995/03/01. 7742399.
6. Michels KB, Terry KL, Willett WC. Longitudinal study on the role of body size in premenopausal breast cancer. Arch Intern Med. 2006;166(21):2395–402. Epub 2006/11/30. 166/21/2395 [pii] doi: 10.1001/archinte.166.21.2395 17130395.
7. Dowsett M, Folkerd E. Reduced progesterone levels explain the reduced risk of breast cancer in obese premenopausal women: a new hypothesis. Breast Cancer Res Treat. 2015;149(1):1–4. Epub 2014/11/22. doi: 10.1007/s10549-014-3211-4 25414027.
8. Bhaskaran K, Douglas I, Forbes H, dos-Santos-Silva I, Leon DA, Smeeth L. Body-mass index and risk of 22 specific cancers: a population-based cohort study of 5.24 million UK adults. Lancet. 2014;384(9945):755–65. doi: 10.1016/S0140-6736(14)60892-8 25129328; PubMed Central PMCID: PMC4151483.
9. Morimoto LM, White E, Chen Z, Chlebowski RT, Hays J, Kuller L, et al. Obesity, body size, and risk of postmenopausal breast cancer: the Women's Health Initiative (United States). Cancer Causes Control. 2002;13(8):741–51. Epub 2002/11/08. 12420953.
10. Munsell MF, Sprague BL, Berry DA, Chisholm G, Trentham-Dietz A. Body mass index and breast cancer risk according to postmenopausal estrogen-progestin use and hormone receptor status. Epidemiol Rev. 2014;36(1):114–36. Epub 2014/01/01. doi: 10.1093/epirev/mxt010 [pii]. 24375928; PubMed Central PMCID: PMC3873844.
11. Potischman N, Swanson CA, Siiteri P, Hoover RN. Reversal of relation between body mass and endogenous estrogen concentrations with menopausal status. J Natl Cancer Inst. 1996;88(11):756–8. Epub 1996/06/05. 8637031.
12. Rich-Edwards JW, Goldman MB, Willett WC, Hunter DJ, Stampfer MJ, Colditz GA, et al. Adolescent body mass index and infertility caused by ovulatory disorder. Am J Obstet Gynecol. 1994;171(1):171–7. Epub 1994/07/01. 0002-9378(94)90465-0 [pii]. 8030695.
13. Michailidou K, Hall P, Gonzalez-Neira A, Ghoussaini M, Dennis J, Milne RL, et al. Large-scale genotyping identifies 41 new loci associated with breast cancer risk. Nat Genet. 2013;45(4):353–61, 61e1–2. Epub 2013/03/29. doi: 10.1038/ng.2563 [pii]. 23535729; PubMed Central PMCID: PMC3771688.
14. Howie B, Fuchsberger C, Stephens M, Marchini J, Abecasis GR. Fast and accurate genotype imputation in genome-wide association studies through pre-phasing. Nat Genet. 2012;44(8):955–9. Epub 2012/07/24. doi: 10.1038/ng.2354 [pii]. 22820512; PubMed Central PMCID: PMC3696580.
15. Liu EY, Li M, Wang W, Li Y. MaCH-admix: genotype imputation for admixed populations. Genet Epidemiol. 2013;37(1):25–37. Epub 2012/10/18. doi: 10.1002/gepi.21690 23074066; PubMed Central PMCID: PMC3524415.
16. Hindorff LA, Sethupathy P, Junkins HA, Ramos EM, Mehta JP, Collins FS, et al. Potential etiologic and functional implications of genome-wide association loci for human diseases and traits. P Natl Acad Sci USA. 2009;106(23):9362–7. doi: 10.1073/pnas.0903103106 ISI:000266817500047.
17. Locke AE, Kahali B, Berndt SI, Justice AE, Pers TH, Day FR, et al. Genetic studies of body mass index yield new insights for obesity biology. Nature. 2015;518(7538):197–206. Epub 2015/02/13. doi: 10.1038/nature14177 [pii]. 25673413; PubMed Central PMCID: PMC4382211.
18. Ripatti S, Tikkanen E, Orho-Melander M, Havulinna AS, Silander K, Sharma A, et al. A multilocus genetic risk score for coronary heart disease: case-control and prospective cohort analyses. Lancet. 2010;376(9750):1393–400. Epub 2010/10/26. doi: 10.1016/S0140-6736(10)61267-6 [pii]. 20971364; PubMed Central PMCID: PMC2965351.
19. Harrison SC, Holmes MV, Humphries SE. Mendelian randomisation, lipids, and cardiovascular disease. Lancet. 2012;380(9841):543–5. Epub 2012/05/23. doi: 10.1016/S0140-6736(12)60481-4 [pii]. 22607824.
20. Do R, Willer CJ, Schmidt EM, Sengupta S, Gao C, Peloso GM, et al. Common variants associated with plasma triglycerides and risk for coronary artery disease. Nat Genet. 2013;45(11):1345–52. Epub 2013/10/08. doi: 10.1038/ng.2795 [pii]. 24097064; PubMed Central PMCID: PMC3904346.
21. Frank J, Lang M, Witt SH, Strohmaier J, Rujescu D, Cichon S, et al. Identification of increased genetic risk scores for schizophrenia in treatment-resistant patients. Mol Psychiatry. 2014. Epub 2014/06/04. doi: 10.1038/mp.2014.56 [pii]. 24888364.
22. Zhang Y, Rosenberg L, Colton T, Cupples LA, Palmer JR, Strom BL, et al. Adult height and risk of breast cancer among white women in a case-control study. American journal of epidemiology. 1996;143(11):1123–8. 8633601.
23. Bowden J, Smith GD, Burgess S. Mendelian randomization with invalid instruments: effect estimation and bias detection through Egger regression. Int J Epidemiol. 2015;44(2):512–25. doi: 10.1093/ije/dyv080 WOS:000357106100015. 26050253
24. Inoue A, Solon G. Two-Sample Instrumental Variables Estimators. Rev Econ Stat. 2010;92(3):557–61. doi: 10.1162/Rest_a_00011 ISI:000279729000009.
25. Palmer TM, Sterne JA, Harbord RM, Lawlor DA, Sheehan NA, Meng S, et al. Instrumental variable estimation of causal risk ratios and causal odds ratios in Mendelian randomization analyses. Am J Epidemiol. 2011;173(12):1392–403. Epub 2011/05/11. doi: 10.1093/aje/kwr026 [pii]. 21555716.
26. Thomas DC, Lawlor DA, Thompson JR. Re: Estimation of bias in nongenetic observational studies using "Mendelian triangulation" by Bautista et al. Ann Epidemiol. 2007;17(7):511–3. Epub 2007/05/01. S1047-2797(07)00055-5 [pii] doi: 10.1016/j.annepidem.2006.12.005 17466535.
27. Burgess S, Butterworth A, Thompson SG. Mendelian randomization analysis with multiple genetic variants using summarized data. Genet Epidemiol. 2013;37(7):658–65. Epub 2013/10/12. doi: 10.1002/gepi.21758 24114802.
28. Hartung J, Knapp G, Sinha BK. Statistical meta-analysis with applications. Hoboken, N.J.: Wiley; 2008. xv, 247 p. p.
29. Calle EE, Kaaks R. Overweight, obesity and cancer: epidemiological evidence and proposed mechanisms. Nat Rev Cancer. 2004;4(8):579–91. Epub 2004/08/03. doi: 10.1038/nrc1408 [pii]. 15286738.
30. Rukh G, Ahmad S, Ericson U, Hindy G, Stocks T, Renstrom F, et al. Inverse relationship between a genetic risk score of 31 BMI loci and weight change before and after reaching middle age. Int J Obesity. 2016;40(2):252–9. doi: 10.1038/ijo.2015.180 WOS:000369691500010.
31. Baer HJ, Tworoger SS, Hankinson SE, Willett WC. Body fatness at young ages and risk of breast cancer throughout life. Am J Epidemiol. 2010;171(11):1183–94. Epub 2010/05/13. [pii]. 20460303; PubMed Central PMCID: PMC2915489.
32. Willett WC, Browne ML, Bain C, Lipnick RJ, Stampfer MJ, Rosner B, et al. Relative weight and risk of breast cancer among premenopausal women. Am J Epidemiol. 1985;122(5):731–40. Epub 1985/11/01. 4050766.
33. Bardia A, Vachon CM, Olson JE, Vierkant RA, Wang AH, Hartmann LC, et al. Relative weight at age 12 and risk of postmenopausal breast cancer. Cancer Epidemiol Biomarkers Prev. 2008;17(2):374–8. Epub 2008/02/06. doi: 10.1158/1055-9965.EPI-07-0389 [pii]. 18250344; PubMed Central PMCID: PMC2575770.
34. Tworoger SS, Missmer SA, Barbieri RL, Willett WC, Colditz GA, Hankinson SE. Plasma sex hormone concentrations and subsequent risk of breast cancer among women using postmenopausal hormones. J Natl Cancer Inst. 2005;97(8):595–602. Epub 2005/04/21. 97/8/595 [pii] doi: 10.1093/jnci/dji099 15840882.
35. Carr MC. The emergence of the metabolic syndrome with menopause. J Clin Endocrinol Metab. 2003;88(6):2404–11. Epub 2003/06/06. doi: 10.1210/jc.2003-030242 12788835.
36. Ballard-Barbash R. Anthropometry and breast cancer. Body size—a moving target. Cancer. 1994;74(3 Suppl):1090–100. Epub 1994/08/01. 8039144.
37. Willett WC. Diet and breast cancer. J Intern Med. 2001;249(5):395–411. Epub 2001/05/15. jim822 [pii]. 11350564.
38. Kaplowitz PB. Link between body fat and the timing of puberty. Pediatrics. 2008;121:S208–S17. doi: 10.1542/peds.2007-1813F WOS:000253792600004. 18245513
39. Klesges RC, Meyers AW, Klesges LM, Lavasque ME. Smoking, Body-Weight, and Their Effects on Smoking-Behavior—a Comprehensive Review of the Literature. Psychol Bull. 1989;106(2):204–30. doi: 10.1037//0033-2909.106.2.204 WOS:A1989AN31400003. 2678202
40. Chiolero A, Faeh D, Paccaud F, Cornuz J. Consequences of smoking for body weight, body fat distribution, and insulin resistance. Am J Clin Nutr. 2008;87(4):801–9. WOS:000255012000003. 18400700
41. KritzSilverstein D, BarrettConnor E. Long-term postmenopausal hormone use, obesity, and fat distribution in older women. Jama-J Am Med Assoc. 1996;275(1):46–9. WOS:A1996TM23800021.
42. Lahmann PH, Hoffmann K, Allen N, van Gils CH, Khaw KT, Tehard B, et al. Body size and breast cancer risk: findings from the European Prospective Investigation into Cancer And Nutrition (EPIC). Int J Cancer. 2004;111(5):762–71. Epub 2004/07/15. doi: 10.1002/ijc.20315 15252848.
43. Chen WY, Colditz GA. Risk factors and hormone-receptor status: epidemiology, risk-prediction models and treatment implications for breast cancer. Nat Clin Pract Oncol. 2007;4(7):415–23. doi: 10.1038/ncponc0851 WOS:000247588400011. 17597706
44. Speliotes EK, Willer CJ, Berndt SI, Monda KL, Thorleifsson G, Jackson AU, et al. Association analyses of 249,796 individuals reveal 18 new loci associated with body mass index. Nat Genet. 2010;42(11):937–48. Epub 2010/10/12. doi: 10.1038/ng.686 [pii]. 20935630; PubMed Central PMCID: PMC3014648.
45. Berndt SI, Gustafsson S, Magi R, Ganna A, Wheeler E, Feitosa MF, et al. Genome-wide meta-analysis identifies 11 new loci for anthropometric traits and provides insights into genetic architecture. Nat Genet. 2013;45(5):501–12. Epub 2013/04/09. doi: 10.1038/ng.2606 [pii]. 23563607; PubMed Central PMCID: PMC3973018.
46. Smith GD. Mendelian randomization for strengthening causal inference in observational studies: Application to gene X environment interactions (vol 5, pg 527, 2010). Perspect Psychol Sci. 2011;6(3):314-. ISI:000290736400011.
Štítky
Interné lekárstvoČlánok vyšiel v časopise
PLOS Medicine
2016 Číslo 8
- Familiární hypercholesterolemie: zaslouženě v centru pozornosti
- Projekt MedPed: péče o nemocné s familiární hypercholesterolémií v České republice
- Mutace v genu PCSK9 zodpovědné za rozvoj familiární hypercholesterolémie
- Hypolipidemika v terapii akutních koronárních syndromů
- Přirozeně nízké hladiny LDL-cholesterolu představují ochranu před rozvojem kardiovaskulárních chorob
Najčítanejšie v tomto čísle
- Glycemic Control and the Risk of Tuberculosis: A Cohort Study
- Transitioning to Country Ownership of HIV Programs in Rwanda
- Dementia across the Lifespan and around the Globe—Pathophysiology, Prevention, Treatment, and Societal Impact: A Call for Papers
- Social Dancing and Incidence of Falls in Older Adults: A Cluster Randomised Controlled Trial